
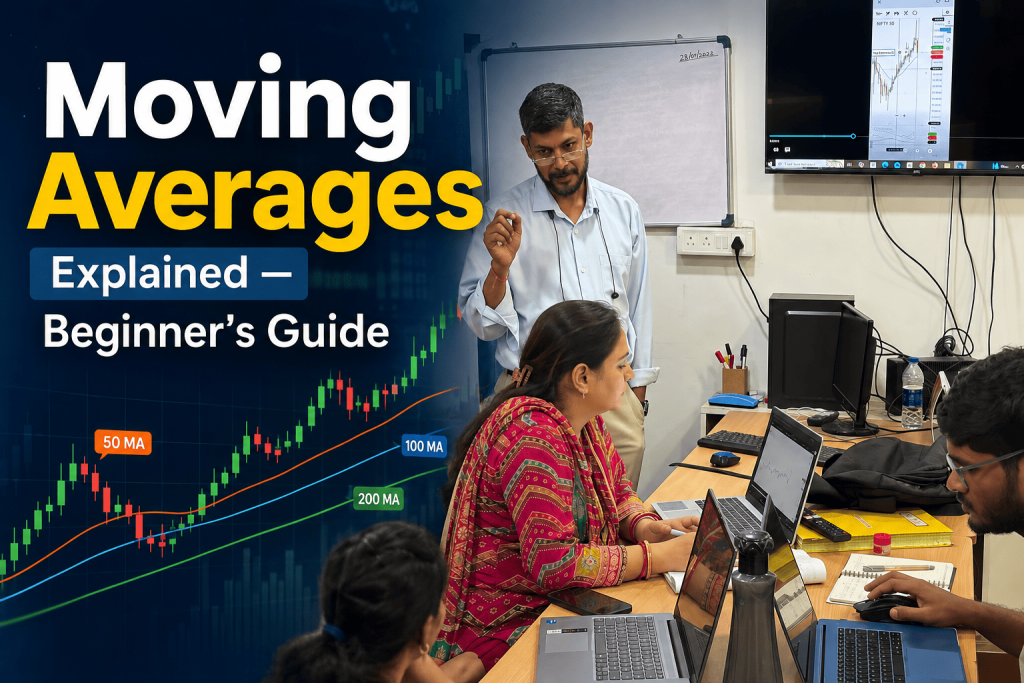
Confused by moving averages on stock charts? Here’s a simple, beginner-friendly explanation of how this indicator works.
Moving Averages Explained — Beginner’s Guide
If you’ve spent any time looking at stock charts, you’ve probably noticed smooth, flowing lines running across the price candles. These are moving averages — one of the simplest yet most widely used tools in technical analysis. This guide breaks down what they are, how to use them, and why they form one of the very first topics taught in any serious technical analysis course in Mumbai.
What Is a Moving Average?
A moving average simply takes the average closing price of a stock or index over a specific number of periods — say, the last 20 days — and plots it as a single continuous line on the chart. As each new day’s price comes in, the oldest day drops off the calculation, so the average keeps “moving” forward, smoothing out the day-to-day noise of price action.
The main purpose of a moving average is to help you see the underlying trend more clearly, without getting distracted by every small up-and-down movement.
Simple Moving Average (SMA) vs Exponential Moving Average (EMA)
There are two moving averages every beginner should know:
- Simple Moving Average (SMA): Gives equal weight to every price in the chosen period. A 20-day SMA simply averages the last 20 closing prices equally.
- Exponential Moving Average (EMA): Gives more weight to recent prices, making it react faster to new information than the SMA.
Traders often prefer EMAs for shorter-term trading because of their responsiveness, while SMAs are commonly used for longer-term trend confirmation. Neither is universally “better” — the right choice depends on your trading style and time frame, something covered in detail in structured share market classes in Mumbai.

How Traders Use Moving Averages
1. Identifying Trend Direction
If the price is consistently trading above a rising moving average, the trend is generally considered bullish. If price is below a falling moving average, the trend is generally considered bearish. This simple visual check helps traders avoid fighting the broader market direction.
2. Support and Resistance
In an uptrend, a moving average often acts as a dynamic support level — price dips down to touch it and then bounces back up. In a downtrend, the same average can act as resistance, where price rallies up to it and then falls again. Recognising this pattern is a core skill taught in any practical technical analysis course.
3. Crossover Signals
One of the most popular strategies involves watching two moving averages of different lengths — for example, a 50-day and a 200-day average. When the shorter average crosses above the longer one, it’s often called a “golden cross” and is viewed as a bullish signal. When it crosses below, it’s called a “death cross,” typically viewed as bearish. While useful, these signals work best when combined with other confirmation, not used in isolation.
4. Filtering False Signals
Moving averages are also used as a filter — for instance, only taking bullish trade setups when price is above the 200-day average, to avoid trading against the dominant long-term trend. This kind of rule-based filtering is a foundational concept in most candlestick chart courses and technical trading systems.
Common Mistakes Beginners Make
- Using too many moving averages at once, cluttering the chart until it becomes impossible to make a clear decision.
- Ignoring the time frame — a moving average that works well on a daily chart may behave very differently on a 5-minute intraday chart.
- Treating every crossover as a guaranteed signal, without considering volume, broader trend, or other confirming indicators.
- Applying the same settings to every stock, without adjusting for volatility or sector behaviour.

Choosing the Right Period for Your Strategy
Shorter moving averages (like 9 or 20-day) react quickly and suit short-term or intraday traders, but they also generate more false signals due to their sensitivity. Longer moving averages (like 50, 100, or 200-day) are smoother and better suited to long-term trend identification, but they react more slowly to sudden changes.
Most experienced traders use a combination — a short-term average for entries and exits, alongside a longer-term average to confirm the overall trend direction — a layered approach typically taught step by step in a structured stock market classes in Andheri West program, using live Nifty and Bank Nifty charts for practice.
Why This Matters More Than It Seems
Moving averages seem simple on the surface, but understanding how to combine them with price action, support and resistance, and volume is what separates a structured technical trader from someone randomly drawing lines on a chart. This is precisely the kind of practical, hands-on skill that a good technical analysis course in Mumbai builds over weeks of guided chart practice, not a single video tutorial. At IITA, based at Crystal Plaza, opposite Infinity Mall, Andheri West, our technical analysis module covers moving averages alongside candlestick patterns, support and resistance, and volume analysis — all taught using live market charts so students can apply concepts in real time.
Frequently Asked Questions
Q: Which moving average is best for beginners — SMA or EMA? Beginners often start with SMA for simplicity, then explore EMA as they get comfortable with faster signals.
Q: Can moving averages predict future price movement? No, they reflect past price behaviour and help identify trend direction, not guarantee future outcomes.
Q: Do I need multiple moving averages on one chart? Two, at most three, is usually sufficient — more than that often creates confusion rather than clarity.
📞 Book Your Free Career & Market Guidance Session Today!
Not sure where to begin? Speak with our academic counselors and discover the right learning path based on your goals.
📍 Mumbai Office: Crystal Plaza, Opposite Infinity Mall, Andheri West, Mumbai
💻 Training Mode: 100% Live Online Classes
📞 Call / WhatsApp: +91 84520 18280 , +91 91870 98700
🌐 Website: https://iita.tech/stockmarket-course-in-mumbai/
📸 Follow us on Instagram: @stockmarketcourse_iita
Subscribe to Our YouTube Channels: 🔹 IITA Official: www.youtube.com/@iitab 🔹 Sudha Das (Market Learning): www.youtube.com/@sudhadas8420 🔹 www.youtube.com/@subratdas2506
Disclaimer: Stock market trading involves financial risk. This article is for educational purposes only and is not investment advice.
IITA – https://iita.tech/stockmarket-course-in-mumbai/