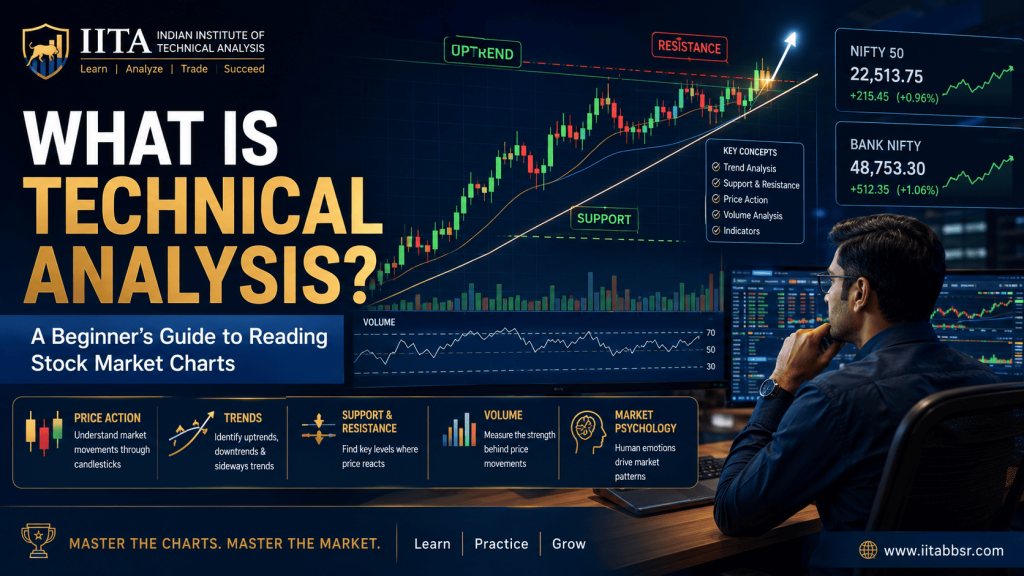
What Is Technical Analysis? A Simple Beginner’s Guide
The Core Idea Behind Technical Analysis
Technical analysis rests on three foundational beliefs:
- Price reflects everything. All known information – company earnings, news, economic data, even market sentiment – is already reflected in the current price. So by studying price, you are indirectly studying everything that affects it.
- Prices move in trends. Markets do not move randomly. They move in recognisable uptrends, downtrends, and sideways ranges. Once a trend starts, it tends to continue until something changes it.
- History tends to repeat itself. Price patterns and market behaviours tend to recur because human psychology – fear, greed, hope, panic – does not change. The same emotional reactions create the same chart patterns across decades and markets.
Technical Analysis vs Fundamental Analysis
These are the two main approaches to evaluating the stock market, and they answer different questions:
- Fundamental analysis asks: “Is this company worth buying?” It studies the company’s financial statements, earnings, revenue, debt, management quality, and industry position. Investors use it to decide what to buy.
- Technical analysis asks: “When should I buy or sell?” It studies price charts, trends, patterns, volume, and indicators. Traders use it to decide when to act.
Many successful market participants use both: fundamental analysis to select good companies, and technical analysis to time their entry and exit. However, active traders (especially intraday and swing traders) rely primarily on technical analysis because they are focused on short-term price movements, not long-term company value.
What Tools Does Technical Analysis Use?
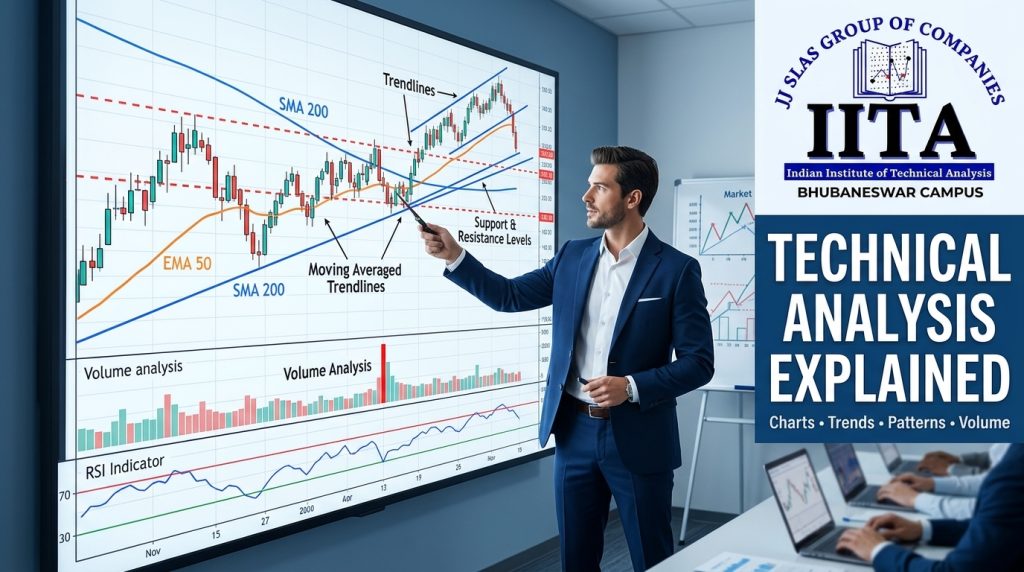
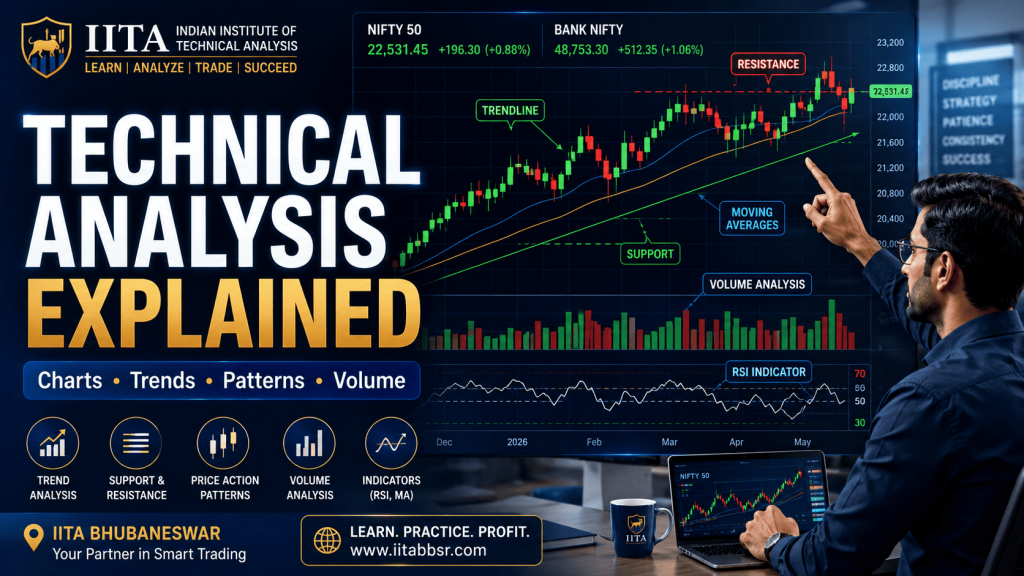
Technical analysis uses a set of visual and mathematical tools applied to price charts. The main categories are:
1. Price Charts
The foundation of all technical analysis. Candlestick charts are the most popular, showing the open, high, low, and close for each time period. (See our detailed guide on how to read stock charts for beginners.)
2. Trends and Trendlines
Identifying whether price is in an uptrend, downtrend, or sideways range is the most fundamental skill. Trendlines drawn along swing lows (in uptrends) or swing highs (in downtrends) help visualise the trend.
3. Support and Resistance Levels
Key price levels where buying or selling pressure tends to appear. These levels help traders plan entries, exits, and stop losses. (See our guide on support and resistance in trading.)
4. Candlestick Patterns
Specific formations of one, two, or three candles that suggest potential reversals or continuations – like Hammer, Doji, Engulfing, Morning Star, and more. (See our guide on candlestick patterns for beginners.)
5. Chart Patterns
Larger formations that develop over days or weeks, such as Head and Shoulders, Double Top, Double Bottom, Triangles, Flags, and Wedges. These patterns signal potential trend reversals or continuations.
6. Technical Indicators
Mathematical calculations applied to price and volume data, displayed as lines or histograms on or below the chart. Common indicators include Moving Averages, RSI (Relative Strength Index), VWAP, MACD, and Bollinger Bands. (See our guide on best indicators for intraday trading.)
7. Volume Analysis
Studying how much trading activity accompanies price moves. High volume confirms a move is genuine. Low volume suggests the move may be weak or unsustainable.
Who Uses Technical Analysis?
- Day traders (intraday traders) who open and close positions within the same day
- Swing traders who hold positions for days to weeks
- Options traders who need to time entries and exits precisely
- Even long-term investors who use technical analysis to decide better entry and exit timing for fundamentally strong stocks

Does Technical Analysis Actually Work?
This is the honest answer: technical analysis is not a crystal ball. It does not predict the future with certainty. What it does is give you a probability-based framework for making decisions. When the trend is up, a support level is holding, volume is confirming, and a bullish pattern forms, the odds favour a further rise – but it is never guaranteed.
The traders who succeed with technical analysis are those who combine it with strict risk management (always using stop losses, managing position sizes) and emotional discipline (not overtrading, not revenge trading). Technical analysis gives you the edge. Risk management and discipline protect the edge.
Common Misconceptions About Technical Analysis
- “It’s just drawing lines.” It is a systematic, evidence-based study of price behaviour. The lines represent decades of market psychology research.
- “It doesn’t work because the market is random.” Markets are not purely random. They are driven by human behaviour, which follows recognisable patterns.
- “Fundamental analysis is better.” Neither is universally better. They answer different questions. For short-term trading, technical analysis is essential. For long-term investing, fundamentals are primary.
- “You need expensive software.” Free platforms like TradingView, Zerodha Kite, and most broker apps provide all the charting tools you need.
Frequently Asked Questions About Technical Analysis
What is technical analysis in simple words?
Technical analysis is the study of price charts and trading volume to identify trends, patterns, and potential trading opportunities. It helps traders decide when to buy, sell, or stay out of the market based on what the chart is showing, rather than analysing company financials.
What is the difference between technical analysis and fundamental analysis?
Fundamental analysis evaluates a company’s financial health (earnings, debt, revenue) to determine what to buy. Technical analysis studies price charts and indicators to determine when to buy or sell. Traders typically use technical analysis; long-term investors typically use fundamental analysis. Many professionals use both.
Can a beginner learn technical analysis?
Yes. Technical analysis can be learned step by step: start with chart types, then trends, then support/resistance, then candlestick patterns, then indicators. With structured guidance and practice, most beginners can learn the basics in 4–6 weeks. Applying it confidently in live markets takes longer.
Is technical analysis enough to be profitable?
Technical analysis gives you an edge in identifying opportunities, but profitability also requires strict risk management, emotional discipline, and a clear trading plan. No analysis method alone guarantees profits.
Learn Technical Analysis the Right Way at IITA Bhubaneswar
IITA is literally the Indian Institute of Technical Analysis – it is what we do, and it is all we do. Our entire curriculum is built around teaching you how to read charts, identify patterns, use indicators, and trade with a plan, on live markets.
We do not waste time on motivational talks or vague theory. Every session is practical, using live Nifty, Bank Nifty, and stock charts so you learn by doing, not just watching.
What Makes IITA the Right Choice for Technical Analysis
Curriculum designed from the ground up for technical analysis – not a generic finance course
Live chart analysis on real market data during every session
Progressive learning path – from chart basics to advanced patterns and strategies
Experienced traders as trainers who practise what they teach
Post-course access to mentor-led market analysis sessions
Classroom and online formats available
Ready to learn the skill that professional traders rely on? Visit iita.tech or call us for a free workshop.
Disclaimer: Stock market trading involves financial risk. This article is for educational purposes only and is not investment advice.
IITA – iita.tech