
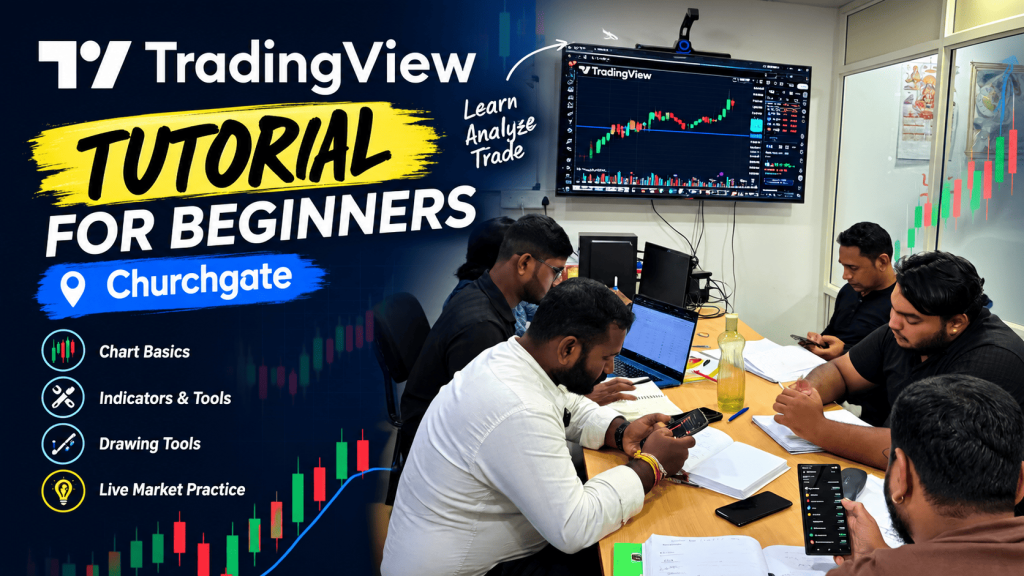
Confused by charts and indicators? This TradingView tutorial for beginners breaks down everything step by step. Learn to trade smarter with IITA Mumbai.
TradingView Tutorial for Beginners
Walk into any trading desk near Churchgate and you’ll notice the same glowing charts on almost every screen — green and red candles, moving lines, little pop-up alerts. Chances are, most of those screens are running TradingView. If you’ve just started exploring the markets and keep hearing this name thrown around, this TradingView tutorial for beginners is exactly where you should start.
TradingView isn’t just a charting tool. It’s become the default workspace for retail traders across India, from casual investors tracking Nifty movements to full-time intraday traders scalping five-minute candles. But like most powerful tools, it can feel overwhelming the first time you open it. Too many buttons, too many indicators, too much jargon. Let’s fix that.
Getting Started: Setting Up Your Account
The first step in any TradingView tutorial for beginners is simply creating an account. You can sign up for free using an email address, and the free version is genuinely usable — you don’t need to pay anything to start learning. Once you’re in, you’ll land on a blank chart screen, which is where most of the confusion begins.
Search for a stock or index — try typing “NIFTY” or “RELIANCE” into the search bar at the top. Within seconds, you’ll see a live (or slightly delayed, depending on your plan) chart populate the screen. That’s your canvas for everything you’ll do going forward.
Understanding the Chart Basics
Before touching a single indicator, spend time simply understanding what the chart is showing you. By default, TradingView displays candlestick charts, and each candle represents price movement over a chosen time frame — one minute, five minutes, a day, a week, whatever you select from the toolbar.
A green (or sometimes blue, depending on your colour settings) candle means the price closed higher than it opened. A red candle means the opposite. The thin lines above and below the candle body, called wicks or shadows, show the highest and lowest price reached during that period. This single concept — reading a candle — is arguably the most important skill covered in any TradingView tutorial for beginners, because everything else builds on it.
Timeframes: Choosing the Right View
New traders often make the mistake of staring at a one-minute chart and trying to make sense of every tiny flicker. Zoom out. TradingView lets you switch timeframes instantly using the toolbar near the top of the chart. If you’re a beginner, start by observing daily and weekly charts to understand the bigger trend before you ever attempt to trade intraday movements.
Adding Indicators Without Overloading Your Chart
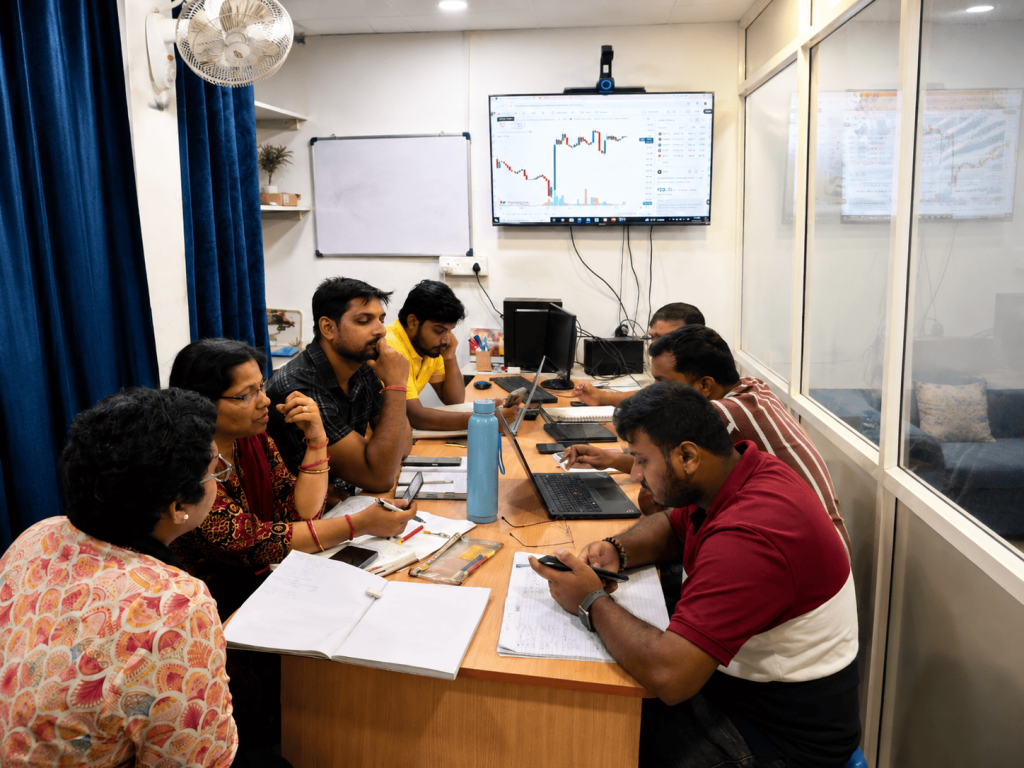
This is where most people go wrong. They open TradingView, discover there are hundreds of indicators available, and start adding all of them — moving averages, RSI, MACD, Bollinger Bands, Fibonacci retracements — until the chart becomes unreadable clutter.
A practical approach for beginners is to pick two or three indicators you genuinely understand and stick with them until you’ve mastered how they behave. A simple moving average crossover strategy, paired with the Relative Strength Index (RSI) to gauge overbought or oversold conditions, is more than enough to start building your analytical instincts. You’ll find the “Indicators” tab at the top of the chart — click it, search for what you want, and it gets added instantly.
Drawing Tools: Trendlines and Support/Resistance
One of the more underrated features covered in most TradingView tutorials for beginners is the drawing toolbar on the left-hand side of the screen. This is where you manually mark support and resistance zones, draw trendlines, and identify chart patterns like triangles or channels.
Support and resistance are simply price levels where a stock has historically struggled to move past, either on the way up or the way down. Marking these manually, rather than relying purely on automated indicators, trains your eye to actually read price action — a skill that separates traders who understand the market from those who just follow signals blindly.
Setting Alerts So You’re Not Glued to the Screen
You don’t need to sit in front of your screen all day watching every tick. TradingView allows you to set price alerts, indicator-based alerts, and even alerts for specific candlestick patterns. Right-click on the chart, select “Add Alert,” and configure the condition — say, notify me when Nifty crosses 25,000. This one feature alone can save you hours of unnecessary screen time once you get comfortable using it.
Watchlists: Organising What You Track
As you start following more stocks and indices, your watchlist becomes your command centre. On the right-hand panel, you can create custom watchlists grouped by sector, strategy, or whatever system makes sense to you. Instead of switching between dozens of browser tabs, everything sits in one organised place.
Free vs Paid Plans: What Beginners Actually Need
TradingView offers a free tier along with several paid subscription levels. For someone just starting out, the free version covers almost everything you need — charting, basic indicators, alerts, and watchlists. As you grow more serious about trading and need real-time data without delays, or want to run more indicators simultaneously, upgrading becomes worth considering. But there’s no rush to pay for anything in your first few months of learning.
Common Mistakes Beginners Make on TradingView
A few patterns show up again and again among new users. Overloading charts with too many indicators is one. Ignoring the timeframe context — analysing a five-minute chart while ignoring the daily trend — is another. Some beginners also get distracted by TradingView’s social features, copying “ideas” published by random users instead of developing their own analytical process. TradingView is a tool, not a substitute for actual market knowledge.
Why Structured Learning Still Matters
Reading a TradingView tutorial for beginners like this one gives you the technical know-how to navigate the platform, but knowing which button does what isn’t the same as knowing how to read the market. Understanding why a stock is forming a particular pattern, what news is driving volatility, and how to combine technical analysis with risk management takes structured guidance and practice under real market conditions.
That’s the gap our courses at IITA Mumbai are designed to close. We don’t just teach you to click around a charting platform — we teach you how professional traders actually think, using TradingView and other tools as part of a complete, practical curriculum. Whether you’re near Churchgate, South Mumbai, or anywhere else in the city, our classes are built for beginners who want a real foundation, not just a collection of tricks.
TradingView is an excellent starting point. But like any tool, its value depends entirely on the trader using it.
Final Thought
Futures trading in India isn’t something you master by reading a single article — it’s a skill built through consistent practice, disciplined risk management, and a genuine understanding of how leverage, margins, and expiry cycles work together. The traders who succeed long-term are rarely the ones chasing quick wins; they’re the ones who treat every trade as a calculated decision backed by real knowledge. If you’re serious about learning futures trading in India the right way, investing in structured guidance now will save you from expensive lessons later.
Frequently Asked Questions (FAQ)
1. Is futures trading in India suitable for beginners? Yes, but only with proper training. Futures trading involves leverage and daily settlement, so beginners should start with paper trading or small positions after understanding the basics of margin, lot size, and expiry.
2. How much capital do I need to start futures trading in India? This depends on the margin requirement for the specific contract you’re trading. Since futures use leverage, you don’t need the full contract value, but you should have enough capital to absorb potential losses comfortably.
3. What is the difference between futures and options in India? Futures contracts obligate both parties to complete the transaction at expiry, while options give the buyer the right, but not the obligation, to exercise the contract. This makes the risk profiles of the two quite different.
4. Can I lose more money than I invested in futures trading? Yes. Because futures trading involves leverage, losses can exceed your initial margin if the market moves sharply against your position, which is why stop-losses and risk management are essential.
5. Where can I learn futures trading in India properly? Structured courses that combine theory with live market practice, like those offered by IITA Mumbai, are a practical way to learn futures trading in India without relying purely on trial and error.
📞 Book Your Free Career & Market Guidance Session Today!
Not sure where to begin? Speak with our academic counselors and discover the right learning path based on your goals.
📍 Office: Andheri West, Mumbai
💻 Training Mode: Both Offline & Online Classes available
📞 Call / WhatsApp: +91 84520 18280, +91 91870 98700
🌐 Website: https://iita.tech/stockmarket-course-in-mumbai/
📸 Follow us on Instagram: @stockmarketcourse_iita
Subscribe to Our YouTube Channels: 🔹 IITA Official: https://www.youtube.com/@iitab 🔹 Sudha Das (Market Learning): https://www.youtube.com/@sudhadas8420 🔹 Subrat Das: https://www.youtube.com/@subratdas2506
Disclaimer: Stock market trading involves financial risk. This article is for educational purposes only and is not investment advice.
IITA – https://iita.tech/stockmarket-course-in-mumbai/