
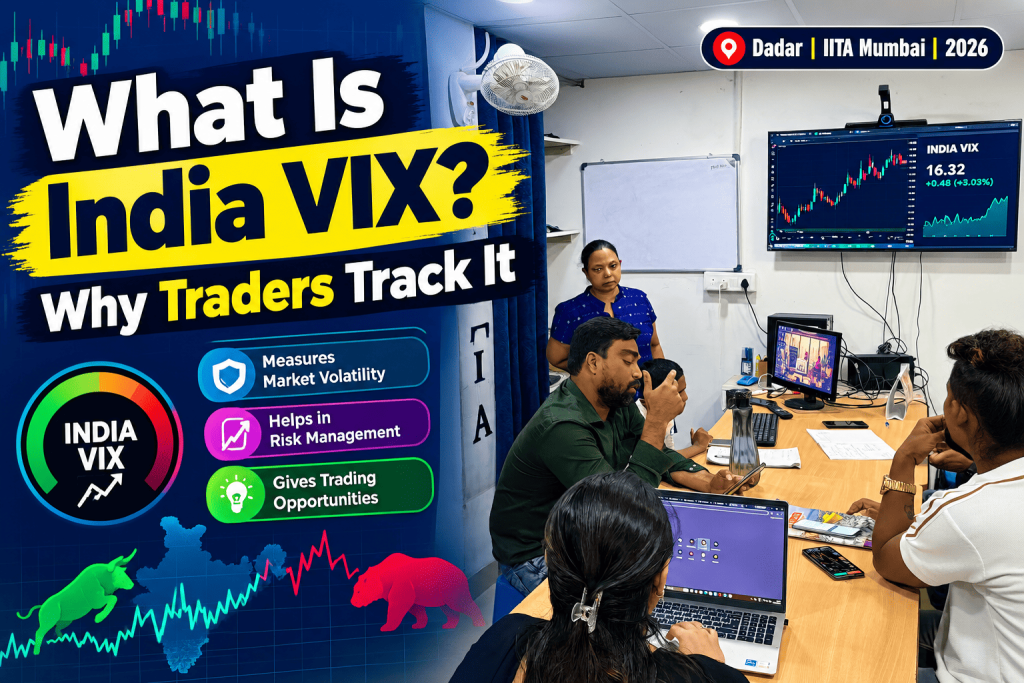
Curious what is India VIX and why it matters? This guide explains how the volatility index is calculated and used by Dadar traders. Learn more at IITA.
What Is India VIX, and Why Do Serious Traders Watch It So Closely?
A student in Dadar once pointed at a small, quietly ticking number on his dashboard — sitting right beside Nifty and Sensex but clearly not a stock or an index in the usual sense — and asked what it even was. Fair question. That number is India VIX, and understanding what is India VIX and why it matters turns out to be one of the more genuinely useful things a trader can learn.
The Straightforward Definition
India VIX is a volatility index, calculated by the NSE, that measures the market’s expectation of how turbulent things are likely to get over the next 30 days — derived from the pricing of Nifty options. Unlike a normal index, it’s not tracking company performance at all. It’s tracking expected movement, which makes it a fundamentally different kind of number from anything else on your dashboard.
How the Number Actually Gets Built
The calculation pulls from the order book of Nifty options — specifically the bid-ask prices across a spread of out-of-the-money calls and puts, near-month and next-month expiries both. The exact formula borrows from the globally established CBOE VIX methodology, translating all that options pricing into a single annualised volatility percentage.
Why Everyone Calls It the “Fear Index”
The nickname earns itself. This index tends to spike hard whenever genuine panic or uncertainty grips the market, and settle back down during calmer, more confidently trending stretches. That relationship — fear pushes it up, confidence lets it drift back down — has held up remarkably consistently across Indian market history.
The Inverse Dance With Nifty
Here’s the pattern worth internalising: when Nifty drops sharply, India VIX usually spikes right alongside it, fear and uncertainty feeding the number higher. When Nifty grinds steadily upward instead, VIX tends to ease off as confidence — sometimes complacency — settles in. It’s not a perfect, mechanical relationship, but it’s strong enough that plenty of traders use VIX levels as a genuine sentiment gauge alongside whatever the price chart is showing.
What Traders Actually Do With This Number
- Options traders check VIX to gauge whether premiums across the board look expensive or cheap right now
- Portfolio managers treat a climbing VIX as an early cue to think about hedging existing equity exposure
- Short-term traders often tighten stop-losses or trim position sizes when VIX is elevated, given the higher odds of sharp, erratic swings
- Contrarian-minded investors sometimes read an extreme VIX spike as a sign of overdone fear — occasionally lining up with market bottoms
What Counts as “High” Anyway?
There’s no fixed universal number here — what matters is relative to its own recent history. Readings well above the usual range tend to coincide with elections, global shocks, or unexpected geopolitical flashpoints. On the flip side, an unusually low reading can signal a market that’s grown a bit too comfortable, sometimes right before volatility picks back up again.
The Connection Back to Options Pricing
This ties directly into Vega, one of the option Greeks. Since this index reflects the market’s collective expectation of volatility, a rising VIX generally lifts implied volatility across Nifty options broadly — pushing premiums up even without the underlying index actually moving. Both buyers and sellers of options need to keep this dynamic in mind.
Where It Falls Short
It’s not a crystal ball. It reflects current expectation, not a locked-in forecast, and it can occasionally stay elevated — or unusually quiet — for longer than historical patterns would suggest is “normal.” Treating it as one useful input among several, rather than a standalone trading signal on its own, tends to serve traders far better than leaning on it exclusively.
What Happened During Past Market Shocks
Looking back at how this index behaved during genuinely turbulent stretches — the 2020 pandemic crash being the most extreme recent example — is instructive. Readings that normally sit in a fairly narrow range spiked to multiples of their usual level within days, reflecting just how much uncertainty flooded into options pricing almost overnight. Traders who were watching this number closely during that period had an early, quantifiable signal that something structurally different was happening, well before it became obvious in every headline.
That’s not to say it predicted the crash — it didn’t, and it isn’t designed to. What it did do was confirm, in real time, that the market’s own pricing of near-term uncertainty had shifted dramatically, which is exactly the kind of confirmation that’s hard to get from a price chart alone.
A Simple Habit for Reading It Daily
You don’t need to obsess over this number to get value from tracking it. A quick daily glance, alongside Nifty’s move for the day, is usually enough. Over a few weeks of doing this, a pattern starts to emerge on its own — you’ll begin noticing, without really trying, that days when the index jumps sharply tend to coincide with genuinely unsettled news flow, while quiet, low readings tend to show up during stretches when the market seems to be drifting on autopilot.
For anyone learning what is India VIX in a practical sense rather than just a textbook definition, this kind of daily observation, sustained over time, builds a far sharper intuition than reading the formula ever will. It’s one of those numbers that rewards patience and repetition far more than a single afternoon of study.
Who Should Actually Be Watching This
Not every market participant needs to track this closely, and that’s worth saying plainly. If you’re a long-term investor with a well-diversified portfolio and a genuinely long time horizon, checking what is India VIX shows once a week is probably more than sufficient — it’s context, not a decision-making trigger. But if you’re actively trading options, or managing a portfolio through short-term hedges, it deserves a spot on your daily checklist alongside the usual price and volume data you’re already reviewing.
Final Thoughts
Getting what is India VIX genuinely settled in your head gives you a sentiment gauge that price and volume analysis alone simply can’t offer. It measures expected magnitude of movement rather than direction, which makes it a uniquely useful window into market psychology — particularly worth checking during the stretches when everything else on your screen feels uncertain too.

Frequently Asked Questions
Can this figure be traded directly?
Not directly as a cash instrument, though futures contracts based on this index do exist, allowing more advanced traders to take positions specifically on expected volatility rather than on price direction.
How frequently does this figure get updated?
It’s calculated and updated continuously throughout the trading session, in real time, reflecting the constantly shifting prices of the underlying Nifty options used in its calculation.
Does a low reading guarantee a calm market ahead?
No, low readings simply reflect current expectations and can shift quickly if new, unexpected information reaches the market, so a low reading shouldn’t be treated as a guarantee of continued calm.
Is this figure relevant for long-term investors, or only traders?
It’s more directly useful for short-term traders and options participants, though long-term investors can still find it a helpful, quick gauge of overall market nervousness during uncertain periods.
📞 Book Your Free Career & Market Guidance Session Today!
Not sure where to begin? Speak with our academic counselors and discover the right learning path based on your goals.
📍 Office: Andheri West, Mumbai
💻 Training Mode: Both Offline & Online Classes available
📞 Call / WhatsApp: +91 84520 18280, +91 91870 98700
🌐 Website: https://iita.tech/stockmarket-course-in-mumbai/
📸 Follow us on Instagram: @stockmarketcourse_iita
Subscribe to Our YouTube Channels: 🔹 IITA Official: https://www.youtube.com/@iitab 🔹 Sudha Das (Market Learning): https://www.youtube.com/@sudhadas8420 🔹 Subrat Das: https://www.youtube.com/@subratdas2506
Disclaimer: Stock market trading involves financial risk. This article is for educational purposes only and is not investment advice.
IITA – https://iita.tech/stockmarket-course-in-mumbai/