
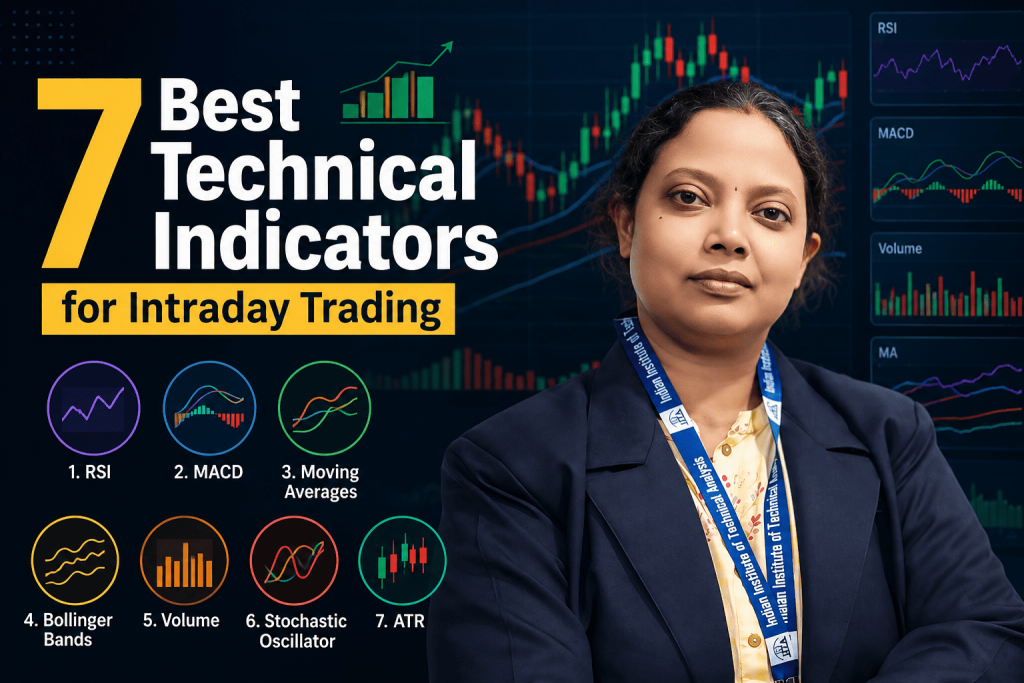
Discover the 7 best technical indicators for intraday trading, how they work, and how to combine them for sharper entries and exits. Guide by IITA Mumbai.
Intraday trading can move very quickly. A stock that looks calm at 10:00 AM can make a sharp move just a few minutes later. Because trades are opened and closed on the same day, traders need a way to understand what is happening without making every decision based on guesswork.
This is where technical indicators can help.
Indicators don’t predict the market with certainty. Instead, they process price and volume data and present it in a way that can make trends, momentum, volatility and potential trading levels easier to analyse.
There are hundreds of indicators available, but you don’t need all of them. In fact, putting too many indicators on one chart can make trading more confusing rather than easier.
In this guide, we’ll look at 7 technical indicators for intraday trading, what each one does, and how traders commonly use them.
Why Use Technical Indicators for Intraday Trading?
When you’re trading intraday, you often have limited time to make a decision.
You may want to know:
- Is the stock trending or moving sideways?
- Is momentum getting stronger or weaker?
- Is the current price relatively high or low compared with recent movement?
- Where could a potential entry or exit make sense?
- How volatile is the stock today?
Technical indicators can help answer some of these questions.
However, an indicator should not be treated as a standalone buy-or-sell machine. It is better to use it as part of a broader trading plan that includes price action, market structure, volume and risk management.
1. Moving Averages
Moving averages are among the simplest indicators to understand and are widely used by intraday traders.
A moving average smooths out price fluctuations and gives you a clearer view of the general direction of the market.
Two commonly used types are:
- SMA (Simple Moving Average)
- EMA (Exponential Moving Average)
An EMA gives greater weight to recent prices, so it tends to react faster than an SMA.
How traders use moving averages
Suppose a stock is consistently trading above a short-term EMA and making higher highs and higher lows. A trader may consider that as evidence that the short-term trend is strong.
Some traders also watch for moving-average crossovers.
For example, a shorter-period EMA moving above a longer-period EMA can be interpreted as improving momentum. But a crossover by itself isn’t necessarily enough to enter a trade. The surrounding price action matters too.
2. Relative Strength Index (RSI)
RSI is a momentum indicator that moves between 0 and 100.
It is commonly used to understand whether recent price movement has become particularly strong in one direction.
Traditionally:
- Above 70 → potentially overbought
- Below 30 → potentially oversold
But these levels should not be treated as automatic reversal signals.
A strong stock can remain above 70 for quite some time during a strong uptrend. Similarly, a weak stock can remain below 30 during a sustained decline.
How traders use RSI
Intraday traders may use RSI to understand momentum or look for divergence.
For example, if price makes a new high but RSI fails to make a corresponding high, some traders interpret this divergence as a sign that momentum may be weakening.
It is a clue—not a guarantee of a reversal.
3. MACD
MACD, or Moving Average Convergence Divergence, is another popular momentum and trend-following indicator.
It is built around the relationship between two moving averages and includes:
- MACD line
- Signal line
- Histogram
How traders use MACD
One common approach is to watch for the MACD line crossing the signal line.
A bullish crossover may indicate that upward momentum is increasing, while a bearish crossover may suggest weakening or downward momentum.
The histogram can also help traders see whether momentum is increasing or decreasing.
MACD can be useful for confirmation, but it can also react relatively slowly during fast intraday moves. This is why many traders combine it with price structure rather than relying on the crossover alone.
4. Bollinger Bands
Bollinger Bands are useful when you want to understand price volatility.
The indicator consists of a middle moving average and two outer bands. The distance between the bands changes according to market volatility.
When volatility increases, the bands generally widen.
When volatility decreases, they tend to come closer together.
How traders use Bollinger Bands
One situation traders watch is a Bollinger Band squeeze, where the bands become relatively narrow.
A period of low volatility can sometimes be followed by a larger price movement, although the indicator itself doesn’t tell you which direction that move will take.
Traders may also study how price behaves around the upper and lower bands, particularly when combined with support, resistance and other price-action information.
5. VWAP
VWAP stands for Volume Weighted Average Price.
For intraday traders, VWAP is particularly useful because it reflects the average price traded during the session while taking volume into account.
Unlike a traditional moving average, VWAP normally resets with each new trading session.
How traders use VWAP
A common approach is to observe where price is trading relative to VWAP.
If price is holding above VWAP and the broader market structure is bullish, some traders may view VWAP as an important reference level.
If price remains below VWAP in a weak market, it can similarly act as a reference for bearish conditions.
VWAP can also behave like a dynamic support or resistance area.
For many intraday traders, VWAP is one of the first indicators worth learning because it provides a simple way to put the day’s price movement into context.
6. Average True Range (ATR)
ATR is slightly different from the other indicators on this list.
It doesn’t tell you whether a stock is bullish or bearish.
Instead, it helps measure volatility.
This can be particularly useful for risk management.
Imagine two stocks. One normally moves ₹2 during a trading session, while another can easily move ₹15.
Using the same stop-loss distance for both wouldn’t make much sense.
How traders use ATR
A higher ATR generally means the stock is experiencing larger price movements.
Traders can use this information when thinking about:
- Stop-loss placement
- Position sizing
- Expected price movement
- Whether a stock is suitable for a particular strategy
ATR should not be used as a reason to take a trade. Its real value is helping you understand how much room the market may need to move.
7. Stochastic Oscillator
The Stochastic Oscillator compares the closing price of a security with its recent price range.
It is generally used to study momentum and potential changes in short-term price behaviour.
Traditionally:
- Above 80 → potentially overbought
- Below 20 → potentially oversold
Traders also watch the relationship between the %K and %D lines for possible signals.
How traders use the Stochastic Oscillator
The indicator can be useful when a market is moving within a range.
For example, a trader may watch for momentum changes near the lower or upper part of a range and then look for confirmation from price action.
However, in a strong trend, an oscillator can remain in an overbought or oversold zone for longer than expected. Context is therefore important.

How Many Indicators Should You Use?
This is where many beginners go wrong.
They discover a new indicator, add it to the chart, then find another one and add that too.
Eventually, the chart is full of signals.
One indicator says buy.
Another says wait.
Another says the market is overbought.
And the trader ends up doing nothing—or taking a trade simply because several indicators appear to agree.
You don’t need seven indicators on your chart just because this article discusses seven.
For most beginners, starting with two or three indicators that serve different purposes can be much easier.
For example:
Trend + Momentum
Moving Average + RSI
The moving average can help identify the broader direction, while RSI can provide additional information about momentum.
Intraday Direction + Price Level
VWAP + Price Action
VWAP can provide an important intraday reference level, while price action can help determine how price is actually behaving around that level.
Volatility + Risk Management
ATR + Price Action
ATR can help you understand volatility while price structure helps you plan entries and invalidation levels.
The important thing is not the number of indicators.
It’s understanding why you are using each one.
Don’t Ignore Price Action
Indicators are calculated from market data. That means they are not separate from price—they are different ways of processing information that comes from price and, in some cases, volume.
This is why it is important to understand the chart itself.
Before taking a trade, ask:
Where is the nearest support or resistance?
What is the current market structure?
Is the stock trending or consolidating?
Is there enough volume?
Where would my trade idea become invalid?
Then use your indicators as additional information rather than letting them make the decision for you.
Frequently Asked Questions
1. Which technical indicators are best for intraday trading beginners?
VWAP, moving averages and RSI are often good starting points because they are relatively straightforward to understand. However, the best combination depends on your trading style and the market you trade.
2. How many indicators should I use for intraday trading?
There is no fixed number, but beginners can start with two or three complementary tools. Using too many indicators often makes the chart harder to interpret.
3. Is VWAP better than a moving average?
Neither is automatically better. They serve different purposes. VWAP is based on the day’s volume-weighted trading activity, while a moving average calculates an average price over a selected period.
4. Can technical indicators guarantee trading profits?
No. Indicators are analytical tools and cannot guarantee profitable trades. Market conditions can change, and every trading strategy can experience losing trades.
5. Can I use these indicators for individual stocks?
Yes. These indicators can be applied to individual stocks as well as indices and other actively traded instruments. However, liquidity and volatility can affect how a particular setup behaves.
6. Should I use indicators with price action?
Many traders do. Price action can help provide context, while indicators can be used for additional confirmation. The combination should be based on a clearly tested trading plan rather than simply adding more signals.
7. Which indicator is most useful for intraday trading?
There isn’t one universal answer. VWAP is particularly popular among intraday traders, while moving averages, RSI, MACD, Bollinger Bands and ATR each provide different types of information.
8. Should beginners trade with these indicators immediately?
It’s better to learn and test your strategy first. Use historical charts and paper trading to understand how the setup behaves before considering real-money trading.
📞 Book Your Free Career & Market Guidance Session Today!
Not sure where to begin? Speak with our academic counselors and discover the right learning path based on your goals.
📍 Office: Andheri West, Mumbai
💻 Training Mode: Both Offline & Online Classes available
📞 Call / WhatsApp: +91 84520 18280, +91 91870 98700
🌐 Website: https://iita.tech/stockmarket-course-in-mumbai/
📸 Follow us on Instagram: @stockmarketcourse_iita
Subscribe to Our YouTube Channels: 🔹 IITA Official: www.youtube.com/@iitab 🔹 Sudha Das (Market Learning): www.youtube.com/@sudhadas8420 🔹 www.youtube.com/@subratdas2506
Disclaimer: Stock market trading involves financial risk. This article is for educational purposes only and is not investment advice.
IITA – https://iita.tech/stockmarket-course-in-mumbai/