Candlestick Patterns for Beginners: 10 Patterns Every Trader Must Know
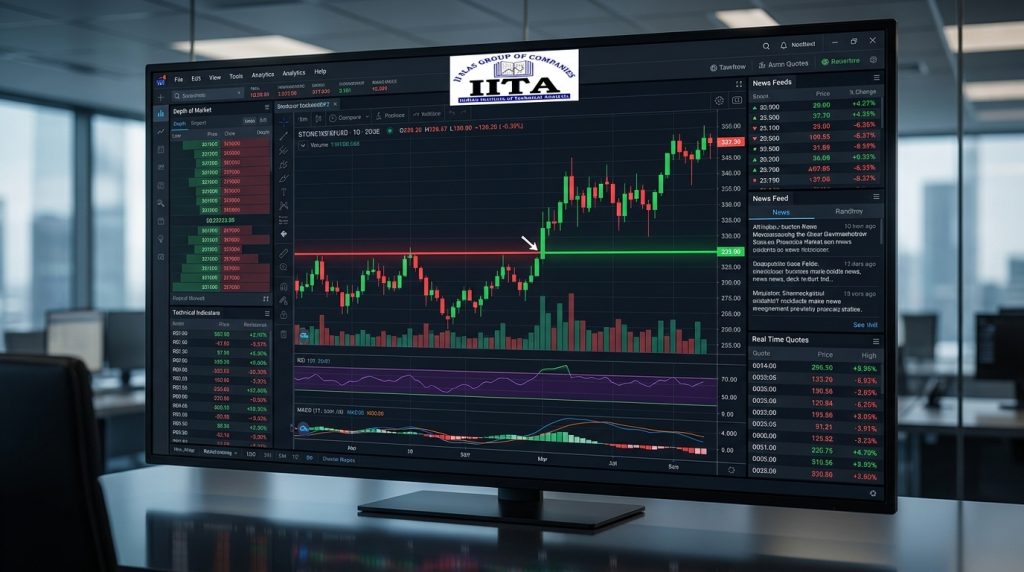
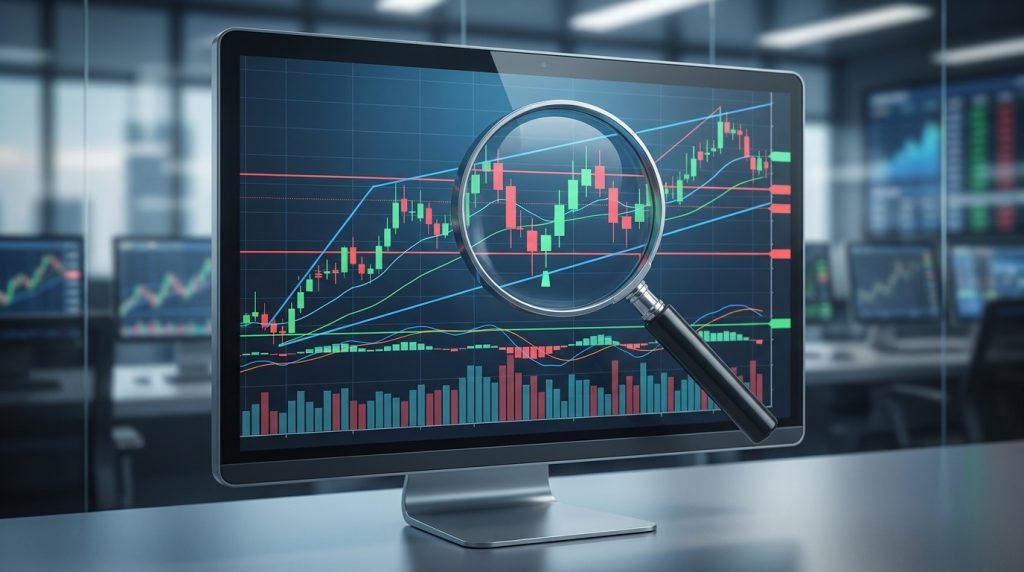
Candlestick patterns are the building blocks of technical analysis. If you have ever opened a stock chart and seen rows of small red and green bars, those bars are called candlesticks, and they tell you the story of every battle between buyers and sellers. Learning to read candlestick patterns is one of the first and most important skills any new trader needs.
This guide explains the 10 most useful candlestick chart patterns in plain, simple English, with examples from Indian markets like Nifty, Bank Nifty, and popular shares. Whether you trade stocks, futures, or options, these patterns work across all markets.
What Is a Candlestick and What Does It Show?
Candlestick Patterns Every Beginner Must Know !
Each candlestick represents one time period, whether that is one minute, one hour, one day, or one week, and shows four prices:
- Open – the price at the start of the period
- Close – the price at the end of the period
- High – the highest price during the period
- Low – the lowest price during the period
The thick middle section is called the body. The thin lines above and below the body are called wicks (also known as shadows). When the close is higher than the open, the candle is usually green (bullish), meaning buyers were stronger. When the close is lower than the open, the candle is usually red (bearish), meaning sellers were stronger.
Once you understand this basic structure, every candlestick pattern below becomes easy to follow, because each pattern is simply a visual story of who was winning at that moment.
Single-Candlestick Patterns
1. Doji Candlestick Pattern
A Doji forms when the open and close prices are almost the same, creating a very thin body with wicks on both sides. It signals indecision, meaning neither buyers nor sellers managed to win. When a Doji appears after a strong uptrend or downtrend, it often warns that the current move is losing steam and a reversal may be near.
Example: If Nifty has been rising strongly for several days and then forms a Doji on the daily chart, it suggests buyers are getting tired and sellers are starting to push back. This does not mean the trend will definitely reverse, but experienced traders become cautious.
2. Hammer Candlestick Pattern
The Hammer has a small body at the top and a long lower wick (at least twice the body length). It appears after a price decline. The long lower wick tells you that sellers pushed the price down sharply during the period, but buyers fought back strongly and pulled the price back up near the open. It is one of the most popular bullish candlestick patterns and suggests a potential reversal upward.
How to confirm it: A Hammer is stronger when it forms near a known support level and is followed by a green candle the next day. Always wait for confirmation before acting.
3. Shooting Star Candlestick Pattern
The Shooting Star is the opposite of the Hammer. It has a small body at the bottom and a long upper wick, appearing after a price rise. It tells you that buyers tried to push higher during the period but sellers took over and dragged the price back down. This is a bearish candlestick pattern and hints that the uptrend might be ending.
Tip: A Shooting Star near a resistance level with high trading volume is a much stronger signal than one appearing randomly.
4. Marubozu Candlestick Pattern
A Marubozu is a long candle with almost no wicks at all. A green (bullish) Marubozu means buyers controlled the price from open to close without any pushback. A red (bearish) Marubozu means sellers dominated completely. It signals strong, one-sided momentum, and traders watch for continuation of the move in the same direction.
Two-Candlestick Patterns
5. Bullish Engulfing Pattern
The Bullish Engulfing pattern consists of a small red candle followed by a larger green candle that completely covers (engulfs) the previous candle’s body. When this appears after a downtrend, it shows that buyers have overpowered sellers and taken control. It is one of the most trusted bullish candlestick patterns and a favourite among beginners for its clarity.
Example: If Reliance shares have been falling and form a small red candle at a support level, followed by a big green candle the next day, that Bullish Engulfing pattern signals a potential trend reversal. Traders often enter a buy position with a stop loss placed just below the low of the pattern.
6. Bearish Engulfing Pattern
The Bearish Engulfing is the mirror image: a small green candle followed by a larger red candle that fully engulfs it, appearing after an uptrend. It signals that sellers have taken control and a decline may follow. Like its bullish counterpart, it is one of the easiest bearish candlestick patterns to spot.
7. Bullish Harami Pattern
The Bullish Harami consists of a large red candle followed by a small green candle that sits entirely within the body of the first candle. “Harami” means “pregnant” in Japanese, describing the smaller candle inside the larger one. It hints that the downtrend is losing strength, though it is a softer signal than the Engulfing pattern and typically needs additional confirmation from volume or the next candle.
Three-Candlestick Patterns
8. Morning Star Pattern
The Morning Star is a three-candle reversal pattern that appears at the bottom of a downtrend:
- First candle: a large red candle showing strong selling
- Second candle: a small candle (can be red or green) showing indecision
- Third candle: a large green candle showing buyers have taken charge
It is one of the most reliable bullish reversal patterns. When it forms near a strong support level with rising volume on the third candle, it carries significant weight.
9. Evening Star Pattern
The Evening Star is the opposite of the Morning Star and appears at the top of an uptrend. It consists of a large green candle, a small indecision candle, and then a large red candle. It signals that the uptrend may be ending and a decline could follow. Traders watch for this pattern near resistance levels.
10. Three White Soldiers Pattern
How to Use Candlestick Patterns Correctly
This is the part most beginners get wrong. A single candlestick pattern is never a guaranteed signal on its own. Successful traders treat these patterns as one piece of evidence within a larger picture. To use candlestick patterns effectively:
- Check the trend: A Hammer at the bottom of a downtrend is meaningful. A Hammer in the middle of nowhere is just noise.
- Look at support and resistance levels: Patterns that form at key price levels are far more reliable. (Read our guide on support and resistance in trading for more on this.)
- Confirm with volume: A Bullish Engulfing pattern backed by high trading volume is much more trustworthy than one with thin volume.
- Use a stop loss: Even the most perfect candlestick pattern can fail. Always set a stop loss to limit your downside, because no pattern works 100% of the time.
- Combine with indicators: Adding one or two technical indicators like RSI or moving averages can improve your decision-making. (See our guide on the best indicators for intraday trading.)
Common Mistakes When Trading Candlestick Patterns
- Trading every single pattern you spot on the chart, most are just noise without context
- Ignoring the overall trend direction and trading against it
- Forgetting to check volume to confirm whether the pattern has real strength behind it
- Not using a stop loss because the pattern looked perfect
- Overcomplicating your chart with dozens of indicators that fight each other
Frequently Asked Questions About Candlestick Patterns
Are candlestick patterns reliable?
They are useful clues, not guarantees. Candlestick patterns work best when combined with the overall trend direction, support and resistance levels, and volume confirmation. No pattern is right 100% of the time, which is why a stop loss is essential.
Which candlestick pattern is best for beginners?
The Bullish Engulfing and Bearish Engulfing patterns are the easiest to spot and among the most reliable. Start with these two and expand your knowledge from there.
Do candlestick patterns work in Indian stock markets?
Yes. Candlestick patterns work on Nifty, Bank Nifty, individual stocks like Reliance, TCS, and HDFC Bank, and across all liquid markets worldwide. The principles are universal because they reflect human psychology, which does not change by geography.
Can I use candlestick patterns for intraday trading?
Absolutely. Day traders use candlestick patterns on shorter timeframes like 5-minute and 15-minute charts. The patterns are the same; the timeframe is different. However, shorter timeframes produce more noise, so confirmation from volume and indicators becomes even more important.
Start Your Trading Education the Right Way with IITA Bhubaneswar
Understanding candlestick patterns from a blog is a good start, but mastering them in real market conditions takes guided practice. That is exactly what IITA (Indian Institute of Technical Analysis) provides.
At IITA Bhubaneswar, we do not just show you pictures of patterns in a textbook. Our experienced trainers walk you through live market charts, helping you spot patterns in real time, understand why some work and others fail, and build the discipline to trade with a plan.

What Makes IITA Different?
- Live market training – learn by reading real charts, not textbook screenshots
- Hands-on practice – you practise spotting and trading patterns during the course itself
- Personal mentorship – small batches so every student gets attention and doubt-clearing
- Post-course support – guidance does not stop when the course ends
- Both Indian and Forex markets – learn to trade Nifty, Bank Nifty, stocks, and global forex markets
- Flexible learning – classroom and online options available
If you are serious about learning technical analysis and trading the right way, visit iita.tech or call us to book a free workshop.
Disclaimer: Stock market trading involves financial risk. This article is for educational purposes only and is not investment advice.
IITA – iita.tech