
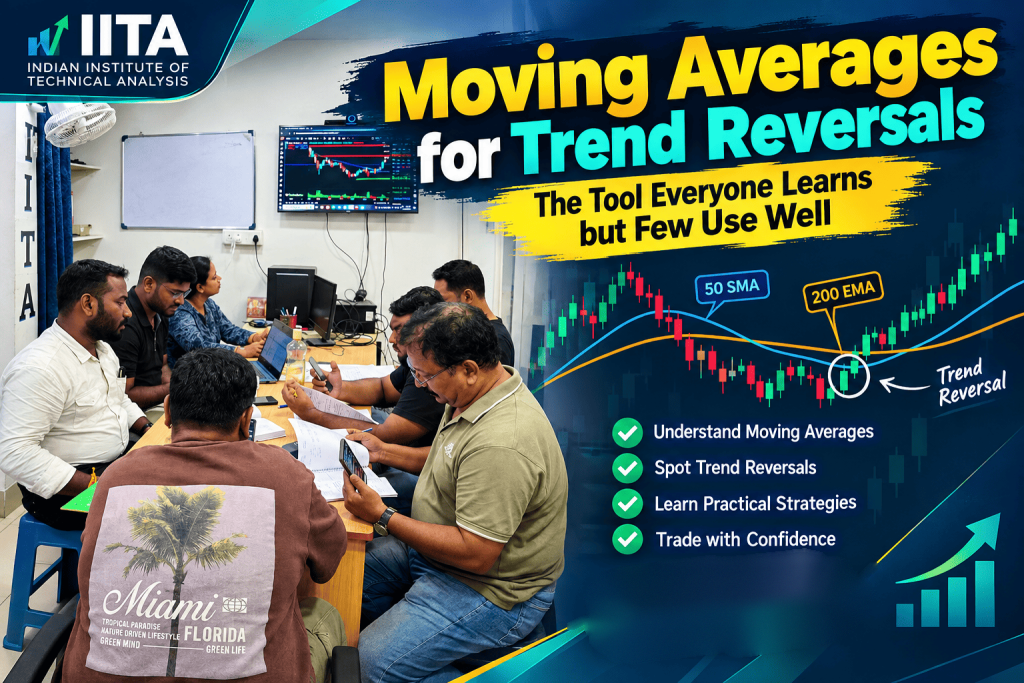
Moving Averages for Trend Reversals: The Tool Everyone Learns but Few Use Well
Learn how to use moving averages for trend reversals, from crossover signals to price interaction. A practical technical analysis guide from IITA.
There’s a reason moving averages are usually the very first technical tool anyone learns, and also the reason so many traders quietly stop taking them seriously a few months in — they get burned by a false signal or two and decide the tool is “unreliable.” It isn’t. It’s just being used wrong. Using moving averages for trend reversals properly is a genuine skill, not a plug-and-play trick, and it’s worth learning that skill instead of abandoning the tool.
The Basic Idea
A moving average smooths out messy day-to-day price noise by averaging price over a set number of periods, continuously updating as fresh data comes in. Two flavours dominate: the Simple Moving Average, which weighs every period equally, and the Exponential Moving Average, which leans more heavily on recent price action. Both show up constantly in discussions of moving averages for trend reversals, though they behave a little differently in how quickly they respond.
Why This Actually Works as a Reversal Signal
Here’s the underlying logic. During a genuine uptrend, price tends to respect its key moving averages — dipping down to touch one on a pullback, then bouncing right back up off it like a floor. When that relationship starts breaking down — when price stops respecting the average that used to act as support — that’s often your earliest clue that the trend underneath is losing its grip.
Crossovers: The Famous Golden and Death Cross
You’ve probably heard these terms thrown around even outside trading circles. A “golden cross” happens when a shorter-period average crosses above a longer one — commonly read as an early bullish signal. A “death cross” is the mirror image, a shorter average dropping below a longer one, often flagged as a warning of trouble ahead.
These get a lot of media attention, sometimes more than they deserve. They’re useful, genuinely — but they’re not magic, and they work far better as one input among several rather than a standalone trigger.
Just Watching Price Cross a Single Average
You don’t always need two averages crossing each other. Sometimes the simplest signal is price itself decisively closing below a major average it had been respecting throughout an uptrend. One clean, convincing close beneath it — not just a brief wick below and back — is often taken more seriously than a hesitant one.
Which Timeframes Traders Actually Watch
- The 20-period average, popular for catching quicker momentum shifts
- The 50-period average, a favourite among swing traders for medium-term trend reads
- The 200-period average, treated almost universally as the long-term trend line — its crossovers with shorter averages get watched closely even by big institutional desks
The Catch Nobody Mentions Early Enough
Moving averages, by their very nature, are backward-looking. They’re built entirely from past price data, so any signal they throw off necessarily comes after some of the move has already happened. This lag is exactly why experienced traders rarely act on a crossover alone — they wait for volume to confirm it, or a candlestick pattern to line up, before actually committing capital.
Where This Falls Apart
Sideways, choppy markets are where moving averages for trend reversals struggle the most. Price whipsaws back and forth across the average, throwing off false signal after false signal, without any genuine new trend actually forming. Before leaning on a crossover, it’s worth asking a simple question first: is this stock actually trending right now, or is it just drifting sideways and about to fake me out?
Stacking Multiple Averages for Better Confirmation
A more disciplined approach uses three averages of different lengths together, rather than relying on a single crossover. When all three line up in the same direction, that’s a meaningfully stronger signal than watching just one pair cross. It’s more patience-intensive, sure, but it filters out a good chunk of the noise that trips up beginners.
A Practical Routine Worth Building
For traders working through this a sensible sequence looks something like: identify the dominant trend using a longer average first, watch for a crossover or a decisive price break as your early flag, then wait for volume or price action to actually confirm it before you commit — rather than jumping in the instant you spot the first hint.

Common Slip-Ups
- Treating every single crossover as an instant trade trigger without waiting for confirmation
- Using average lengths that don’t actually match your own trading timeframe
- Ignoring whether the market is genuinely trending before applying a reversal signal
- Leaning on one average in total isolation instead of pairing it with anything else
A Real Example Worth Walking Through
One of our students recently flagged a stock that had been climbing steadily for weeks, comfortably riding above its 20-period average on every pullback. Then, over two sessions, it closed decisively below that average for the first time in the entire run — not a brief wick, a genuine close below it, on noticeably higher-than-average volume. That combination — the break plus the volume confirmation — was exactly the kind of setup worth paying attention to, and the stock did go on to correct meaningfully over the following week.
What made it a good signal rather than a lucky guess wasn’t the crossover alone. It was waiting for that volume confirmation rather than acting on the very first close below the average. The lesson generalises well beyond this one example: the average tells you something changed, but it’s the surrounding context — volume, broader trend, other confirming signals — that tells you whether to actually act on it.
A Small Checklist Before Acting on Any Signal
Before treating a crossover or a break as genuinely tradeable, run through a short mental checklist: is the broader trend on a higher timeframe actually supportive of this reversal, or fighting against it? Has volume actually picked up around the signal, or is it business as usual? And critically — have you already decided where you’d exit if the signal turns out to be another false one? Skipping that last question is where a lot of otherwise sound setups turn into unnecessarily large losses.
One Last Thing Worth Remembering
No single tool, this one included, is meant to work in isolation. Traders who get genuinely consistent results with moving averages for trend reversals almost always pair them with at least one other form of confirmation — whether that’s a momentum indicator, a support or resistance zone, or simply a broader read of market sentiment that day. Treat the average as one voice in the conversation, not the final word on its own.
Final Thoughts
Moving averages have stuck around in technical analysis for decades because they genuinely work — when used with patience and confirmation, not blind faith. Learning to actually read what price is telling you around these averages, rather than treating every crossover as gospel, is what separates traders who use this tool well from those who gave up on it after one bad trade.

Frequently Asked Questions
Which type of average reacts faster to recent price changes?
The exponential version weighs recent data more heavily and therefore reacts faster than the simple version, which treats every period equally, making the exponential type more popular among shorter-term traders.
Do these tools work equally well on all timeframes?
They tend to produce more reliable signals on higher timeframes like daily or weekly charts, while very short timeframes often generate more noise and false signals, especially during quieter trading sessions.
How many periods should a beginner start with?
Starting with well-established, widely used periods such as 20, 50, and 200 is generally recommended, since these are the same reference points most other market participants are also watching.
Can this approach be combined with other indicators?
Yes, and it often should be. Combining crossover or price-break signals with momentum indicators like RSI, or with volume confirmation, generally produces more reliable reversal signals than relying on averages alone.
📞 Book Your Free Career & Market Guidance Session Today!
Not sure where to begin? Speak with our academic counselors and discover the right learning path based on your goals.
📍 Office: Andheri West, Mumbai
💻 Training Mode: Both Offline & Online Classes available
📞 Call / WhatsApp: +91 84520 18280, +91 91870 98700
🌐 Website: https://iita.tech/stockmarket-course-in-mumbai/
📸 Follow us on Instagram: @stockmarketcourse_iita
Subscribe to Our YouTube Channels: 🔹 IITA Official: https://www.youtube.com/@iitab 🔹 Sudha Das (Market Learning): https://www.youtube.com/@sudhadas8420 🔹 Subrat Das: https://www.youtube.com/@subratdas2506
Disclaimer: Stock market trading involves financial risk. This article is for educational purposes only and is not investment advice.
IITA – https://iita.tech/stockmarket-course-in-mumbai/