
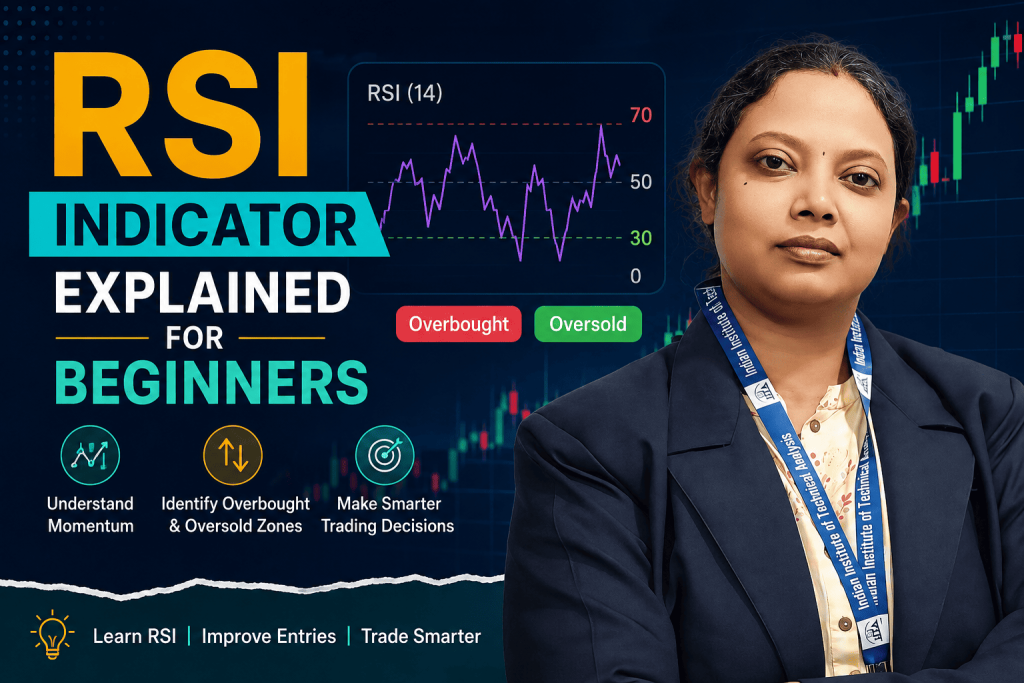
RSI Indicator Explained for Beginners | IITA Mumbai | 2026
Learn what the RSI indicator is, how to read overbought and oversold zones, and why oversold does not always mean “buy”, with a worked example. RSI Indicator Explained for Beginners If you have spent any time on a stock market chart, you have probably noticed a wavy line moving between 0 and 100 sitting just […]
RSI Indicator Explained for Beginners | IITA Mumbai | 2026 Read More »