
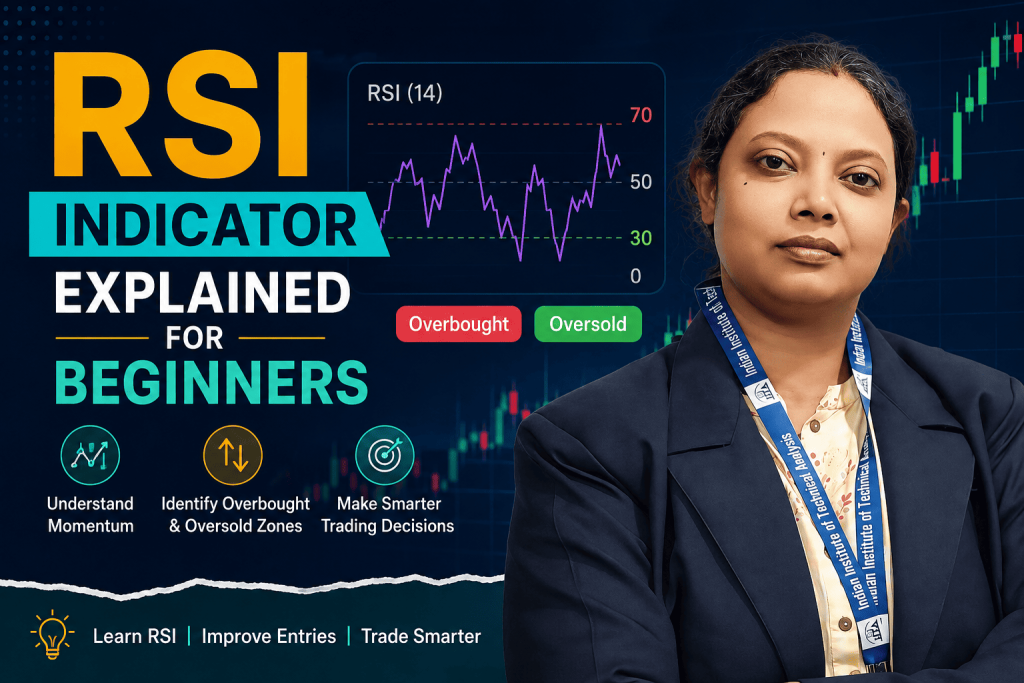
Learn what the RSI indicator is, how to read it, and how Kharghar traders use it to spot overbought and oversold zones. Join IITA Mumbai to master it.
RSI Indicator Explained: A Practical Guide for Traders in Kharghar
If you have spent any time on a stock market chart, you have probably noticed a wavy line moving between 0 and 100 sitting just below the price candles. That line is the Relative Strength Index, better known as the RSI indicator, and it happens to be one of the first tools every serious trader learns to use. For students walking into our classroom from Kharghar, Kamothe, and the wider Navi Mumbai belt, RSI is usually the very first “real” indicator we teach, because it is simple to understand yet powerful enough to use for years.
In this guide, we will break down exactly what the RSI indicator is, how it is calculated, how to read it on a live chart, and how Kharghar-based traders can practically apply it to their daily trading decisions. By the end, you will not just know the theory — you will know how to actually use RSI without falling into the common traps that trip up beginners.
What Is the RSI Indicator?
The RSI indicator is a momentum oscillator developed by J. Welles Wilder. It measures the speed and magnitude of recent price changes to evaluate whether a stock or index is overbought or oversold. The RSI indicator moves on a scale of 0 to 100, and traders generally watch two key zones:
- Above 70: The stock is considered overbought, meaning the recent upward move may be overextended.
- Below 30: The stock is considered oversold, meaning the recent downward move may be overextended.
The idea is not that the price will reverse the moment it touches these levels. Instead, the RSI indicator flags stretched conditions where a pause, pullback, or reversal becomes more likely. Many of our Kharghar students initially treat RSI like a magic buy-sell signal, but experienced traders know it works best when combined with price action and trend context.
How Is RSI Calculated?
You do not need to calculate RSI by hand since every charting platform does it automatically, but understanding the logic helps you trust the number you are looking at. RSI compares the average gains and average losses over a set period, typically 14 candles (14 days on a daily chart, or 14 hours on an hourly chart). The formula essentially converts this ratio into a value between 0 and 100 using the following relationship:
RSI = 100 − [100 / (1 + RS)]
Here, RS stands for the average gain divided by the average loss over the chosen period. A stock that has been rising sharply with few down days will show a high RS, pushing RSI toward 100. A stock falling consistently will push RSI toward 0.

Reading RSI on a Live Chart
When you open a chart of any Nifty stock or index, add the RSI indicator with the standard 14-period setting to begin with. Here is what to watch for:
1. Overbought and Oversold Zones As mentioned, readings above 70 suggest overbought conditions and below 30 suggest oversold conditions. In strongly trending markets, however, RSI can stay above 70 or below 30 for extended periods, so treat these as caution zones, not automatic trade triggers.
2. The Midline at 50 The 50 level acts as a directional filter. When RSI stays consistently above 50, the underlying trend is generally bullish. When it stays below 50, the trend leans bearish. Many Kharghar traders we train use this midline as a simple trend filter before taking any RSI-based entry.
3. RSI Divergence This is where RSI becomes genuinely powerful. A bullish divergence occurs when the price makes a lower low, but RSI makes a higher low — a sign that selling momentum is fading even though price is still falling. A bearish divergence is the opposite: price makes a higher high while RSI makes a lower high, warning that buying momentum is weakening. Divergence is one of the most reliable early-warning signals in technical analysis, and we spend significant classroom time helping students in Kharghar practice spotting it on real charts.
Practical Ways to Use RSI in Your Trading
Combine RSI with Support and Resistance Instead of buying purely because RSI dips below 30, wait for the price to also approach a known support zone. This combination filters out weak signals and improves the odds of your trade working.
Use RSI for Trend Confirmation, Not Just Reversals In a strong uptrend, RSI pulling back to the 40–50 zone (rather than dropping to 30) and then bouncing can be a healthy buy-the-dip signal, since the trend never truly broke down.
Adjust the Period for Your Trading Style Intraday traders sometimes shorten RSI to 9 periods for faster signals, while swing and positional traders often stick with the standard 14 periods or even extend it to 21 for smoother readings. There is no universally “correct” setting — it depends on your trading timeframe and risk appetite.
Avoid Trading RSI in Isolation RSI should never be your only reason to enter a trade. Pair it with volume, price structure, moving averages, or candlestick patterns to build a complete picture before pulling the trigger.
Common Mistakes Kharghar Beginners Make with RSI
We have trained hundreds of students, and a few mistakes come up again and again:
- Buying every time RSI touches 30: In a strong downtrend, RSI can stay oversold for days while price keeps falling. Blindly buying leads to losses.
- Ignoring the broader trend: RSI signals against the dominant trend are lower-probability trades and need extra confirmation.
- Using RSI on illiquid stocks: Thinly traded stocks generate erratic RSI readings that are far less reliable than those on liquid, high-volume names.
- Chasing every divergence: Not every divergence leads to a reversal. Confirm with a break of a trendline or a candlestick reversal pattern before acting.

Why Learning RSI the Right Way Matters
The RSI indicator is deceptively simple to look at, but using it profitably takes practice, patience, and an understanding of market context. Many self-taught traders in Kharghar and Navi Mumbai pick up bits of RSI knowledge from YouTube videos and end up misapplying it, which leads to avoidable losses. Structured, hands-on training with live market examples helps you internalize not just what RSI is, but when and how to trust it.
At IITA, our stock market and trading courses are designed to take you from the basics of chart reading all the way to advanced technical analysis, options strategies, and risk management — all taught through practical, real-market case studies rather than just theory. Whether you are a working professional in Kharghar looking to start trading on the side or a student wanting a serious career in the markets, our classroom and online batches are built to get you there step by step.
Final Thoughts
The RSI indicator remains one of the most trusted tools in a trader’s toolkit because of its simplicity and versatility. Learn to read overbought and oversold zones, respect the 50 midline as a trend filter, and master divergence spotting, and you will already be ahead of most beginner traders. But remember — no single indicator guarantees success. RSI works best as part of a complete trading system built on discipline, risk management, and continuous learning.
Here’s an FAQ section you can add near the end of the article (before the “Book Your Free Career & Market Guidance Session” call-to-action), built around the focus keyword “RSI indicator in trading” and related long-tail questions people commonly search for:

Frequently Asked Questions
1. What is the RSI indicator in trading?
The RSI indicator in trading is a momentum oscillator that measures the speed and magnitude of recent price moves on a scale of 0 to 100. It helps traders identify overbought and oversold conditions in a stock or index.
2. What is a good RSI value for buying a stock?
Traditionally, an RSI below 30 signals an oversold zone, often considered a potential buying opportunity. However, in a strong downtrend, RSI can stay below 30 for extended periods, so it should be confirmed with support levels or a trend reversal signal rather than used alone.
3. What is the best RSI setting for intraday trading?
Most intraday traders use a shorter RSI period, such as 9, for faster and more sensitive signals. Swing and positional traders typically prefer the standard 14-period RSI, while some use 21 for smoother readings on longer timeframes.
4. Can RSI be used alone for trading decisions?
No. While the RSI indicator is a powerful momentum tool, it works best when combined with price action, support and resistance zones, volume, and other indicators like moving averages. Relying on RSI in isolation often leads to false signals.
5. What is RSI divergence and why does it matter?
RSI divergence occurs when price and RSI move in opposite directions — for example, price makes a lower low while RSI makes a higher low (bullish divergence), or price makes a higher high while RSI makes a lower high (bearish divergence). It’s considered one of the more reliable early warning signals of a potential trend reversal.
6. Does RSI work the same way for all stocks?
Not quite. RSI tends to be less reliable on illiquid or thinly traded stocks, where erratic price movement can generate misleading readings. It works best on liquid, high-volume stocks and indices.
7. Where can I learn to use the RSI indicator properly?
Structured, hands-on training with live market examples is the fastest way to learn how to apply RSI correctly. At IITA Mumbai, our stock market and trading courses cover RSI along with other technical analysis tools, taught through real-market case studies for students across Kharghar, Navi Mumbai, and beyond.
📞 Book Your Free Career & Market Guidance Session Today!
Not sure where to begin? Speak with our academic counselors and discover the right learning path based on your goals.
📍 Office: Andheri West, Mumbai
💻 Training Mode: Both Offline & Online Classes available
📞 Call / WhatsApp: +91 84520 18280, +91 91870 98700
🌐 Website: https://iita.tech/stockmarket-course-in-mumbai/
📸 Follow us on Instagram: @stockmarketcourse_iita
Subscribe to Our YouTube Channels: 🔹 IITA Official: https://www.youtube.com/@iitab 🔹 Sudha Das (Market Learning): https://www.youtube.com/@sudhadas8420 🔹 Subrat Das: https://www.youtube.com/@subratdas2506
Disclaimer: Stock market trading involves financial risk. This article is for educational purposes only and is not investment advice.
IITA – https://iita.tech/stockmarket-course-in-mumbai/