
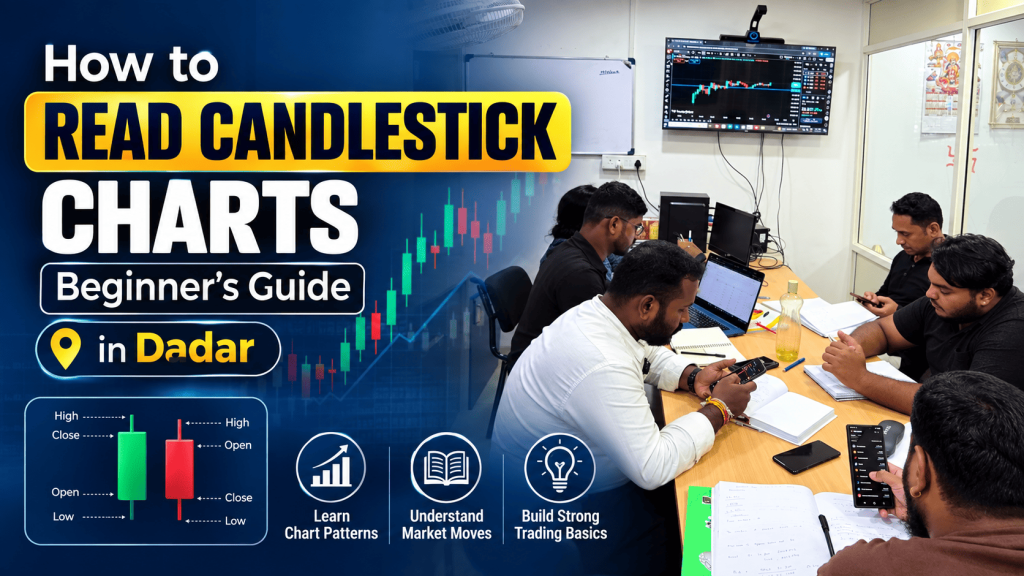
Learn how to read candlestick charts with this beginner-friendly guide from IITA Dadar. Understand patterns, trends, and signals used by traders daily.
How to Read Candlestick Charts — A Beginner’s Guide in Dadar
Sit in on any trading conversation at a coffee shop near Dadar station and you’ll eventually hear someone throw around a phrase like “bullish engulfing” or “hammer candle” like it’s the most obvious thing in the world. For someone just starting out, that same chart looks like a random mess of red and green bars. But once the logic clicks, candlesticks turn into one of the most useful tools you have for reading what the market is actually feeling. Here’s a practical breakdown of candlestick charts for anyone starting from zero — whether you’re in Dadar or anywhere else.
What Is a Candlestick Chart, Exactly?
At its core, it’s just a visual snapshot of price movement over a chosen time window — could be one minute, one day, one week, whatever timeframe you’re working with. Each candle packs in four pieces of information: the opening price, the closing price, and the highest and lowest points reached during that period.
Everything else you’ll eventually learn — every pattern, every signal — is really just a combination of these four numbers. Get comfortable with that first.
The Anatomy of a Single Candle
Every candle has two parts:
- The Body — the thick rectangle showing the range between open and close
- The Wick (or Shadow) — the thin lines above and below showing the highest and lowest prices hit
A green (or white) candle means price closed higher than it opened — buyers were in control. A red (or black) candle means the opposite — sellers had the upper hand.
Why Candlesticks Are the Default, Not Line Charts
Candlestick charts actually go back centuries, to Japanese rice traders tracking prices long before modern stock markets existed. Somewhere along the way they became the global standard for technical analysis, and it’s not hard to see why — a single candle tells you more at a glance than a line chart ever could. That’s exactly why almost every trading app defaults to candlesticks now. For traders squeezing in screen time between work or college classes, that speed matters — you don’t have time to dig through financial reports before making a call.
Patterns Worth Knowing First
Doji Forms when the open and close are nearly identical, leaving a tiny or nonexistent body. It’s basically the market shrugging — indecision — and often shows up right before a reversal.
Hammer and Inverted Hammer A hammer has a small body sitting near the top with a long wick trailing below it. Usually shows up after a downtrend and hints that buyers are starting to step back in. Flip it upside down — long wick on top instead — and you’ve got an inverted hammer.
Bullish and Bearish Engulfing This happens when one candle’s body completely swallows the one before it. A big green candle engulfing a smaller red one usually points to an upward reversal; the reverse — a red candle swallowing a green one — signals the opposite.
Shooting Star Small body near the bottom, long wick stretching upward. Tends to show up after an uptrend and can be an early warning that sellers are taking back control.
Morning Star and Evening Star Both are three-candle formations. A morning star tends to show up at the bottom of a downtrend and hints at a bullish reversal; an evening star does the same at the top of an uptrend, but bearish.
Reading Candles in Context, Not in Isolation
Here’s where a lot of beginners go wrong — spotting a pattern and trading it on its own, without checking anything else around it. A pattern means far more when you factor in:
- Trend direction — a reversal pattern matters more when it’s actually fighting against or lining up with an existing trend
- Support and resistance — a hammer sitting right at a strong support zone carries a lot more weight than one floating in the middle of nowhere
- Volume — a pattern backed by strong volume tends to hold up better than one on thin trading
- Timeframe — daily and weekly candles are generally more trustworthy for beginners than jumpy 1-minute charts
The Only Real Way to Get Good at This
Repetition, honestly. Pull up historical charts — Nifty, Bank Nifty, any large-cap stock — and try guessing the pattern before you check what actually happened next. Do this enough times and your brain starts recognizing shapes almost instinctively, the same way reading eventually stops being about individual letters and starts being about whole words.

Mistakes That Trip Up Almost Everyone Early On
- Treating every minor pattern like it’s a guaranteed signal
- Getting so focused on one candle that the bigger trend gets ignored
- Jumping in without waiting for the next candle to confirm anything
- Cluttering the chart with so many indicators that patterns become impossible to spot
Where to Go From Here
Once single and multi-candle patterns start feeling familiar, the next step is layering in tools like moving averages, RSI, and volume profile alongside them. That combination is more or less the foundation that professional technical traders — in Dadar, across Mumbai, and everywhere else — actually build their decisions on.
Final Thoughts
Candlestick charts won’t predict the future — nothing really does — but they’re one of the clearest windows into crowd psychology that the market gives you. Getting good at reading them takes repetition and real exposure to live data, but once it clicks, it genuinely becomes second nature.

Frequently Asked Questions
I’m a total beginner — where do I even start with candlestick charts? Start with the four basics every candle shows you: open, close, high, and low. From there, pick up a handful of common patterns — Doji, Hammer, Engulfing — before worrying about combining them with trend and volume analysis.
Which pattern should I learn first? The Doji and the Hammer are usually the easiest entry points. They’re single-candle patterns with pretty clear, well-defined shapes, so they’re easy to spot once you know what you’re looking for.
Do these patterns actually work on every timeframe? They show up on every timeframe, technically, but they tend to be far more reliable on daily and weekly charts than on something like a 1-minute or 5-minute chart, which is noisier and easier to misread.
Can I just trade off candlestick patterns alone? Not really a good idea. They’re powerful, but on their own they’re incomplete — pairing them with support/resistance levels, volume, and the broader trend makes a real difference in how reliable your reads are.
Is there somewhere in Dadar to actually practice this properly? Free charting platforms with historical data are a good starting point on your own. If you want structured feedback, a proper technical analysis course with live practice sessions and mentor input — like what IITA runs — tends to speed things up considerably.
📞 Book Your Free Career & Market Guidance Session Today!
Not sure where to begin? Speak with our academic counselors and discover the right learning path based on your goals.
📍 Office: Andheri West, Mumbai
💻 Training Mode: Both Offline & Online Classes available
📞 Call / WhatsApp: +91 84520 18280, +91 91870 98700
🌐 Website: https://iita.tech/stockmarket-course-in-mumbai/
📸 Follow us on Instagram: @stockmarketcourse_iita
Subscribe to Our YouTube Channels: 🔹 IITA Official: www.youtube.com/@iitab 🔹 Sudha Das (Market Learning): www.youtube.com/@sudhadas8420 🔹 www.youtube.com/@subratdas2506
Disclaimer: Stock market trading involves financial risk. This article is for educational purposes only and is not investment advice.
IITA – https://iita.tech/stockmarket-course-in-mumbai/