
Understand the MACD indicator, its components, and how Borivali traders use MACD crossovers and histograms to time entries. Learn it at IITA Mumbai.
MACD Indicator Explained: How Borivali Traders Time Their Trades
Ask any trader which indicator sits on their chart alongside price, and there is a good chance MACD will be one of the answers. The MACD indicator, short for Moving Average Convergence Divergence, is a trend-following momentum tool that has stood the test of time since it was developed by Gerald Appel in the late 1970s. At our training center, we see a steady stream of students from Borivali and the western suburbs who want to understand MACD properly, not just recognize the squiggly lines on their trading app.
This blog will walk you through what the MACD indicator actually measures, how each of its components works together, and how you can use it practically for both intraday and swing trading decisions.
What Is the MACD Indicator?
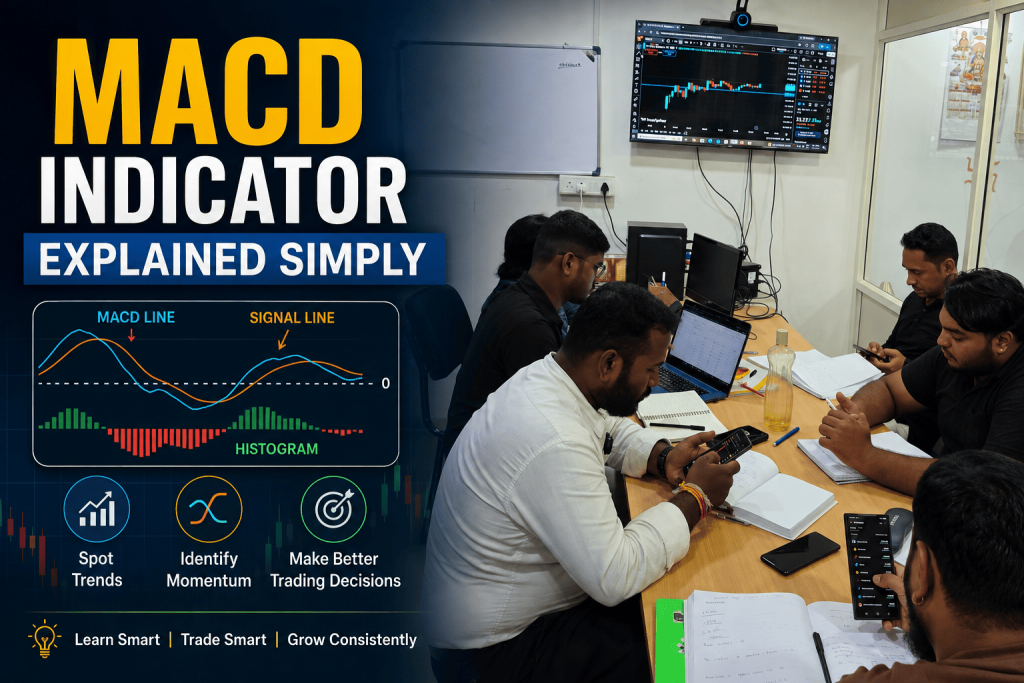
MACD is built from moving averages, but instead of just showing you the moving average itself, it shows you the relationship between two moving averages of different speeds. Specifically, it consists of three elements:
- MACD Line: Calculated by subtracting the 26-period Exponential Moving Average (EMA) from the 12-period EMA.
- Signal Line: A 9-period EMA of the MACD line itself, which smooths it out further.
- Histogram: The visual bars representing the difference between the MACD line and the signal line.
When the faster 12-period EMA moves away from the slower 26-period EMA, the MACD line rises or falls accordingly, capturing shifts in momentum well before they might be obvious from price alone.
Reading the MACD Indicator
MACD Line Crossing Signal Line This is the most commonly used signal. When the MACD line crosses above the signal line, it suggests bullish momentum is building, and traders often view this as a potential buy signal. When the MACD line crosses below the signal line, it hints at weakening momentum and a possible sell or short opportunity.
MACD Crossing the Zero Line The zero line represents the point where the 12-period and 26-period EMAs are equal. When MACD crosses above zero, it confirms that short-term momentum has turned positive relative to the longer-term average — a broader trend confirmation signal. A cross below zero suggests the opposite.
The Histogram The histogram is often overlooked by beginners, but it is genuinely useful. It shows the gap between the MACD line and signal line visually. When histogram bars grow taller, momentum is accelerating. When bars start shrinking even while price is still moving in the same direction, it can be an early warning that momentum is fading before an actual crossover happens.

MACD Divergence: A Trader’s Early Warning System
Similar to RSI, MACD divergence is one of the most respected signals among experienced technical analysts. A bullish divergence forms when price makes a new low, but the MACD line forms a higher low — indicating that selling pressure is losing steam. A bearish divergence forms when price makes a new high while MACD makes a lower high, hinting that the rally may be running out of fuel.
Divergence does not guarantee an immediate reversal, but it is a strong cue to tighten your risk management and watch for confirming price action before the trend actually turns.
How Borivali Traders Apply MACD in Real Trading
For Intraday Trading Intraday traders often use MACD on 5-minute or 15-minute charts to catch momentum shifts within the trading day. A MACD crossover combined with a break of a short-term consolidation range is a popular entry technique among our Borivali-based intraday students.
For Swing Trading Swing traders typically rely on the daily chart, waiting for MACD crossovers near the zero line to confirm the start of a fresh trend, then holding the position for several days to weeks as the trend develops.
Combining MACD with Other Tools MACD works best when paired with price structure and volume. A MACD bullish crossover near a well-tested support zone, accompanied by rising volume, carries far more weight than the same crossover happening in the middle of nowhere on the chart.

Common Mistakes to Avoid with MACD
- Trading every crossover blindly: In sideways, range-bound markets, MACD generates frequent false crossovers that whipsaw traders in and out of positions. Always check whether the broader market is trending or consolidating before relying heavily on crossovers.
- Ignoring the histogram: Many beginners only watch the crossover and miss the early momentum clues the histogram provides.
- Using MACD alone without price context: MACD is a lagging-derivative indicator since it is built from moving averages. It should support your price analysis, not replace it.
- Applying the same settings to every stock: While 12-26-9 is the standard MACD setting, some traders adjust these numbers for faster-moving stocks or specific timeframes. Understand the default before you start experimenting.
Why Structured Learning Makes the Difference
Reading about MACD is one thing; recognizing it correctly in real time, under the pressure of live price movement, is another. We regularly see Borivali students who understood MACD conceptually from online videos but struggled to apply it consistently until they practiced on live charts with proper guidance and feedback.
At IITA, our stock market courses combine classroom theory with hands-on chart practice, live market sessions, and doubt-clearing support, so that concepts like MACD move from “I know what it is” to “I can use it confidently.” Our Andheri West training center offers both offline and online batches, making it convenient for students commuting from Borivali and other parts of Mumbai.
Final Thoughts
The MACD indicator remains a favorite among traders because it captures both trend direction and momentum strength in one compact tool. Learn to read the crossover, respect the zero line, watch the histogram for early signals, and use divergence as your early warning system — and you will have a genuinely reliable indicator in your trading arsenal. As always, pair MACD with sound risk management and a clear trading plan rather than relying on any single indicator in isolation.

Frequently Asked Questions
1. What is the MACD indicator used for?
The MACD indicator is used to identify the direction and strength of a trend by comparing two moving averages of different speeds. It helps traders spot momentum shifts, potential entry and exit points, and early signs of trend reversals.
2. What is the best MACD setting for trading?
The standard MACD setting is 12-26-9, meaning a 12-period EMA, a 26-period EMA, and a 9-period signal line. This is the default used by most trading platforms and is a good starting point for beginners before experimenting with faster or slower settings for specific timeframes.
3. What does it mean when MACD crosses the signal line?
When the MACD line crosses above the signal line, it suggests building bullish momentum and is often read as a potential buy signal. When it crosses below the signal line, it points to weakening momentum and a possible sell or short opportunity.
4. What is the MACD histogram and why is it important?
The histogram represents the gap between the MACD line and the signal line. Growing bars indicate accelerating momentum, while shrinking bars — even while price keeps moving in the same direction — can be an early warning that momentum is fading before an actual crossover occurs.
5. What is MACD divergence?
MACD divergence happens when price and the MACD line move in opposite directions. A bullish divergence forms when price makes a new low but MACD forms a higher low, while a bearish divergence forms when price makes a new high but MACD makes a lower high. It’s considered a strong early cue to watch for a potential trend reversal.
6. Is MACD a leading or lagging indicator?
MACD is generally considered a lagging-derivative indicator since it’s built from moving averages, which are themselves based on past price data. It works best as a confirmation tool alongside price action and support/resistance levels, rather than as a standalone predictor.
7. Can MACD be used for intraday trading?
Yes. Intraday traders often apply MACD on 5-minute or 15-minute charts to catch short-term momentum shifts, frequently combining a MACD crossover with a break of a consolidation range for entries.
8. Where can I learn to use the MACD indicator correctly?
Understanding MACD conceptually is different from applying it confidently on live charts. At IITA Mumbai, our stock market and trading courses combine classroom theory with hands-on chart practice and live market sessions, helping students from Borivali and across Mumbai move from theory to practical, confident application.
📞 Book Your Free Career & Market Guidance Session Today!
Not sure where to begin? Speak with our academic counselors and discover the right learning path based on your goals.
📍 Office: Andheri West, Mumbai
💻 Training Mode: Both Offline & Online Classes available
📞 Call / WhatsApp: +91 84520 18280, +91 91870 98700
🌐 Website: https://iita.tech/stockmarket-course-in-mumbai/
📸 Follow us on Instagram: @stockmarketcourse_iita
Subscribe to Our YouTube Channels: 🔹 IITA Official: https://www.youtube.com/@iitab 🔹 Sudha Das (Market Learning): https://www.youtube.com/@sudhadas8420 🔹 Subrat Das: https://www.youtube.com/@subratdas2506
Disclaimer: Stock market trading involves financial risk. This article is for educational purposes only and is not investment advice.
IITA – https://iita.tech/stockmarket-course-in-mumbai/