What Is the MACD Indicator? A Simple Guide for Beginners

MACD (Moving Average Convergence Divergence) is a popular momentum indicator that shows the relationship between two moving averages of a stock’s price. It helps traders identify the direction of a trend, the strength of momentum, and potential reversal points. MACD is one of the most widely used technical indicators in the world, found on every trading platform and used by both beginners and professionals.
This guide explains what MACD is, how it is built, and how to use its signals in plain, simple English, with practical examples from Indian markets.
What Does MACD Measure?
MACD measures momentum, which is the speed and strength of a price move. It answers two key questions: Is the trend bullish or bearish? And is that trend gaining or losing strength? Because it is based on moving averages, MACD is a trend-following momentum indicator, which makes it useful for confirming the direction of a move.
The Three Parts of MACD
MACD has three components that work together:
1. The MACD Line
This is the heart of the indicator. It is calculated by subtracting the 26-period Exponential Moving Average (EMA) from the 12-period EMA. When the MACD line is positive, short-term momentum is stronger than long-term momentum (bullish). When negative, the opposite (bearish).
2. The Signal Line
This is a 9-period EMA of the MACD line itself. It moves more slowly than the MACD line and acts as a trigger for buy and sell signals. When the MACD line crosses the signal line, it generates a trading signal.
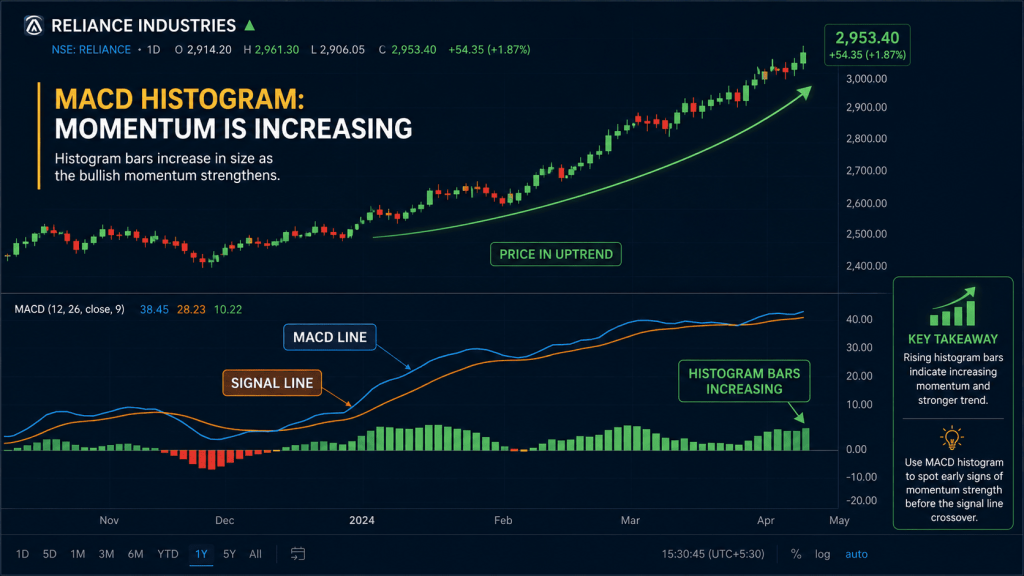
3. The Histogram
The histogram is a series of bars showing the difference between the MACD line and the signal line. When the bars grow taller, momentum is increasing. When they shrink, momentum is fading. The histogram gives you an early visual warning of momentum changes before the lines actually cross.
The standard MACD settings are 12, 26, 9. These are the default on almost every platform and work well for most timeframes. Beginners should not change these until they understand the indicator thoroughly.
How to Read MACD Signals
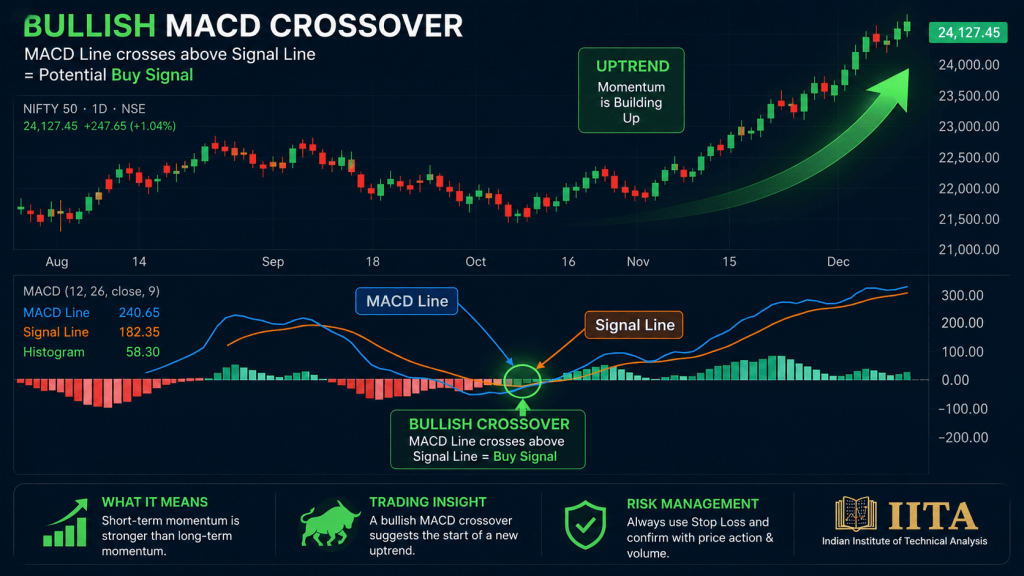
The MACD Crossover (Most Important Signal)
- Bullish crossover: When the MACD line crosses above the signal line, it suggests upward momentum is building – a potential buy signal
- Bearish crossover: When the MACD line crosses below the signal line, it suggests downward momentum – a potential sell signal
Example: If Reliance has been falling and the MACD line crosses above the signal line while both are below zero, it can signal that the downtrend is losing steam and a reversal may be starting. Traders confirm this with price action and volume before entering.
The Zero Line Cross
When the MACD line crosses above the zero line, it confirms a shift to bullish momentum. When it crosses below zero, it confirms bearish momentum. The zero line cross is a slower but more reliable signal than the signal line cross.
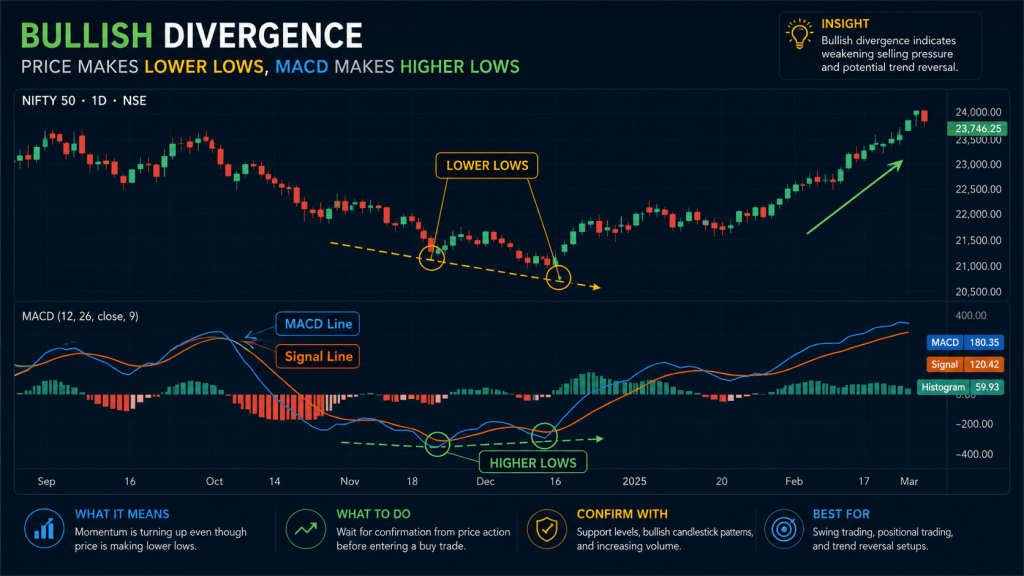
MACD Divergence
Divergence is one of the most powerful MACD signals. It happens when price and MACD move in opposite directions:
- Bullish divergence: Price makes a lower low, but MACD makes a higher low. This suggests selling pressure is weakening and a reversal up may come.
- Bearish divergence: Price makes a higher high, but MACD makes a lower high. This suggests buying pressure is fading and a reversal down may come.
Divergence is an early warning, not an immediate entry signal. Always wait for confirmation.

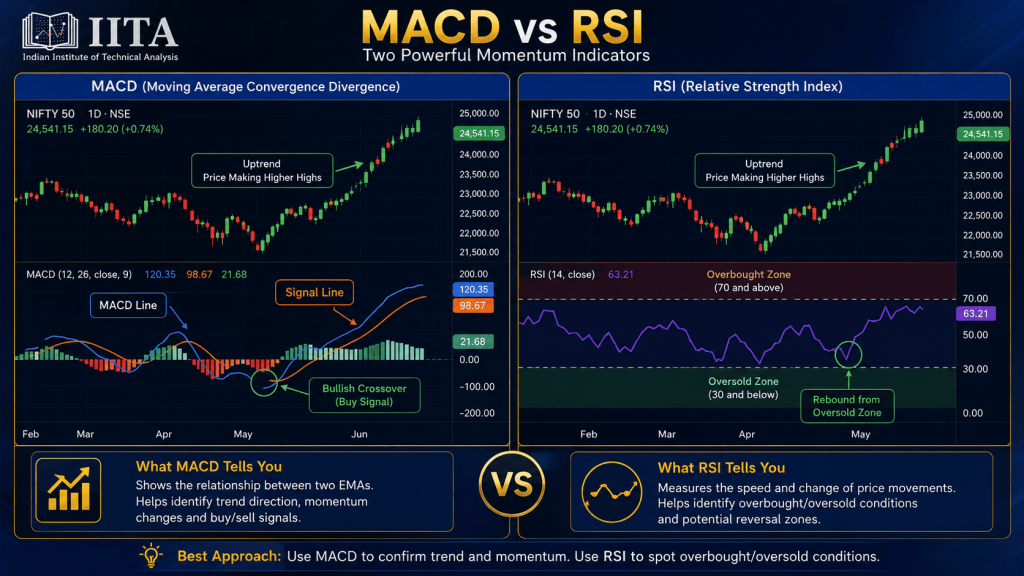
MACD vs RSI: What Is the Difference?
Both are momentum indicators, but they measure different things:
- MACD is trend-following and based on moving averages. It is better at confirming trend direction and momentum shifts.
- RSI (Relative Strength Index) is a bounded oscillator (0–100) that identifies overbought and oversold conditions. It is better at spotting potential reversal zones.
Many traders use them together: RSI to spot when a stock is overbought or oversold, and MACD to confirm the momentum and timing. (See our guide on the best indicators for intraday trading.)

How to Use MACD Effectively
- Confirm the trend first – MACD works best in trending markets, not choppy sideways ones
- Combine crossovers with price action – a crossover near a support/resistance level is stronger
- Use the histogram for early warnings – shrinking bars warn of momentum loss before the cross
- Do not rely on MACD alone – confirm with volume, trend, and other tools
- Always use a stop loss – MACD signals fail like any other indicator
Common Mistakes with MACD
- Using MACD in a sideways market where it produces many false crossovers
- Acting on every crossover without confirmation from price or volume
- Changing the 12, 26, 9 settings randomly without understanding the impact
- Ignoring the broader trend and trading against it based on a single MACD signal
- Trading divergence immediately without waiting for confirmation
Frequently Asked Questions About MACD
What is the MACD indicator in simple words?
MACD is a momentum indicator that uses two moving averages to show whether a stock’s trend is bullish or bearish and whether that momentum is strengthening or weakening. It generates buy and sell signals when its MACD line crosses its signal line.
What are the best MACD settings?
The standard and most widely used MACD settings are 12, 26, 9 (12-period EMA, 26-period EMA, and 9-period signal line). These defaults work well across most timeframes and markets. Beginners should stick with these.
Is MACD good for intraday trading?
Yes, MACD is used for intraday trading on shorter timeframes like 5-minute and 15-minute charts. However, on very short timeframes it can produce false signals, so it should be combined with VWAP, support/resistance, and volume confirmation.
Which is better, MACD or RSI?
Neither is better; they measure different things. MACD is better for confirming trend and momentum. RSI is better for spotting overbought and oversold conditions. Many traders use both together for stronger signals.
Learn to Use MACD and Other Indicators at IITA Bhubaneswar
Knowing what MACD is and using it confidently to make real trading decisions are two very different things. At IITA Bhubaneswar, we teach you how to read MACD signals on live charts and combine them with other tools to build complete trading setups.
Our trainers show you exactly when a MACD crossover is worth acting on and when it is a trap, using real-time Nifty, Bank Nifty, and stock charts during market hours.
Why IITA for Indicator Training
- Live indicator analysis on real market charts during sessions
- Combination strategies – how to use MACD with RSI, VWAP, and price action
- Hands-on practice identifying real signals versus false ones
- Risk management built into every strategy taught
- Both classroom and online training available
Visit iita.tech or call us to book a free workshop.
Disclaimer: Stock market trading involves financial risk. This article is for educational purposes only and is not investment advice.
IITA – iita.tech