
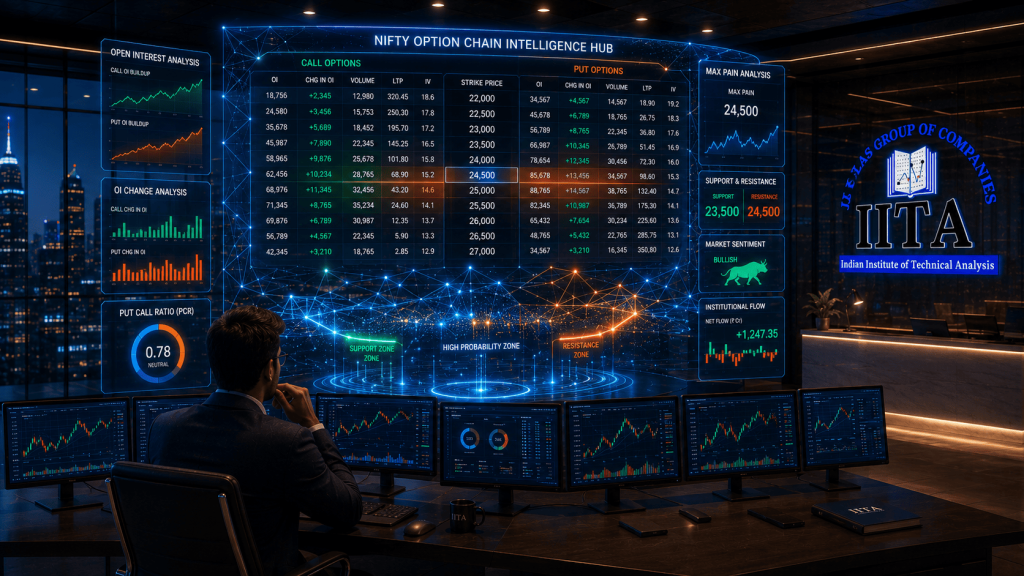
Option Chain Analysis for Beginners: How to Read It and Use It for Trading
The option chain is one of the most information-dense tools available to traders, and one of the most ignored by beginners who find it intimidating. It is a table that shows every available option contract for a stock or index – every strike price, every premium, every piece of data about market positioning – and it tells you things that the price chart alone cannot: where big money is positioned, where the market expects support and resistance, and where the real activity is concentrated.
This guide teaches you how to read an option chain, what each column means, and how to extract actionable trading insights from it.
What Is an Option Chain?
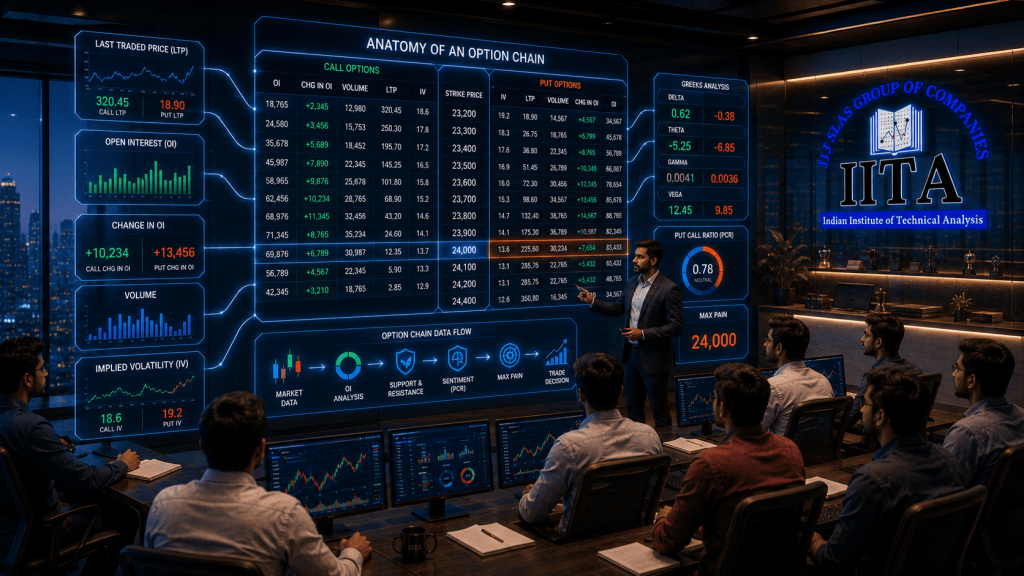
An option chain (also called an options table) is available on your broker’s platform or on NSE’s website. It displays all option contracts for a particular expiry arranged by strike price. Calls are on the left, puts are on the right, strike prices run down the centre. For each strike, you see:
- LTP (Last Traded Price): The current premium of the option
- Open Interest (OI): The total number of outstanding contracts at that strike
- Change in OI: How OI changed from the previous session
- Volume: How many contracts traded today at that strike
- Implied Volatility (IV): The market’s expectation of future volatility, embedded in the premium
- Greeks: Delta, Theta, Gamma, Vega for each option
The Most Important Column: Open Interest (OI)
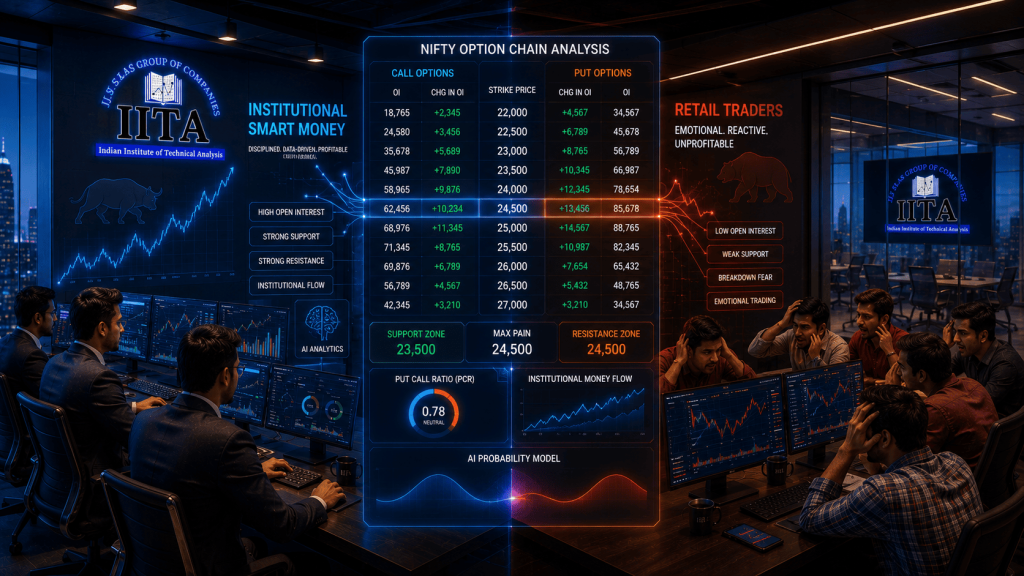
Open Interest is the total number of active (unsettled) contracts at each strike price. It is the single most useful piece of data in the option chain because it shows where money is positioned:
- Highest call OI: Indicates where option writers (sellers) expect resistance – they have sold calls there, betting price will not cross that level. This strike often acts as an implied resistance level
- Highest put OI: Indicates where option writers expect support – they have sold puts there, betting price will not fall below. This strike often acts as an implied support level
Example: If Nifty is at 24,000 and the option chain shows highest call OI at 24,500 and highest put OI at 23,500, the market is collectively pricing Nifty to stay between 23,500 and 24,500 for this expiry. These become your option-chain-derived support and resistance levels.
Change in OI – Following the Smart Money
While total OI shows current positioning, change in OI shows what is happening NOW:
- Rising OI at a call strike: More writers are adding positions, strengthening resistance at that level
- Rising OI at a put strike: More writers are adding positions, strengthening support at that level
- Falling OI (unwinding): Positions being closed – the conviction at that level is weakening
Tracking OI changes throughout the day gives you a real-time map of where institutional positioning is shifting, which is information the price chart does not directly show.
Put-Call Ratio (PCR)
The Put-Call Ratio is calculated as: Total Put OI / Total Call OI. It is a market-wide sentiment indicator:
- PCR above 1.0: More put OI than call OI – suggests put writers are confident (bullish). Counterintuitively, high PCR is bullish because the writers (who are usually better-capitalised and more informed) expect puts to expire worthless
- PCR below 0.7: More call OI relative to puts – suggests call writers are confident (bearish)
- PCR between 0.7–1.0: Neutral territory
PCR is a contrarian indicator: extremes often signal reversals. Very high PCR (above 1.3) can suggest the market is overloaded with put writing and a correction may be coming. Very low PCR (below 0.5) can suggest excessive call writing and a rally potential.
Selecting the Right Strike Price
The option chain helps you choose which option to trade:
- ITM (In-The-Money) options: Higher premium, higher Delta, move more with the underlying. Better for directional conviction trades
- ATM (At-The-Money) options: Moderate premium, Delta around 0.5, highest Theta decay and Gamma. Most responsive to quick moves
- OTM (Out-of-The-Money) options: Low premium, low Delta, need a large move to profit. Attractive because they are cheap; dangerous because most expire worthless
The option chain’s volume column tells you where liquidity is concentrated. Trading liquid strikes ensures tight bid-ask spreads and easy entry/exit. Illiquid strikes (very far OTM, especially) can have wide spreads that eat into your profits.
How to Use the Option Chain in Practice
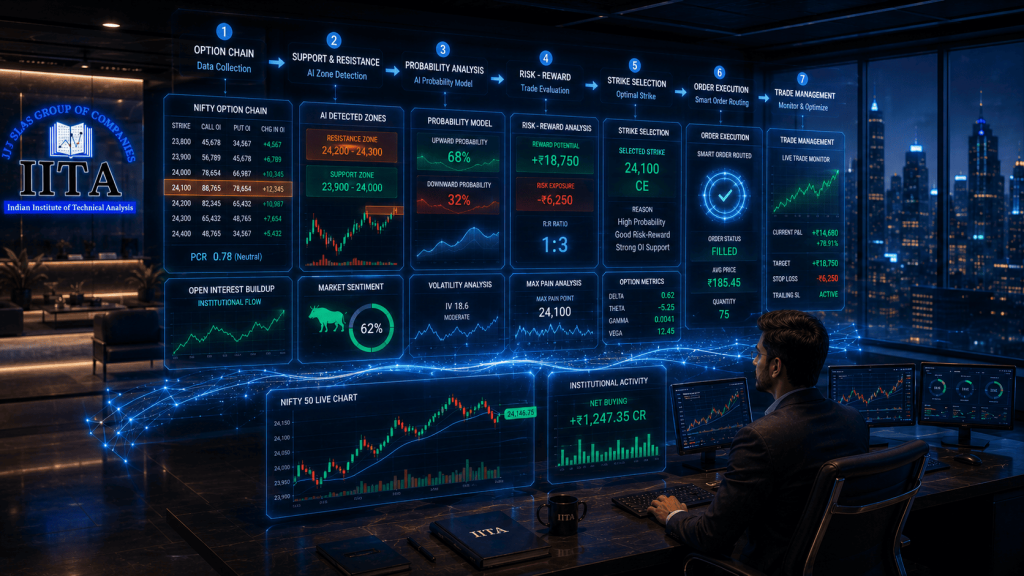
- Morning routine: Check the Nifty option chain to identify the highest call and put OI strikes – these are your implied resistance and support for the day
- During the session: Monitor OI changes to see if support/resistance levels are strengthening or weakening
- Before entering an option trade: Check the IV of the strike you plan to buy. High IV means expensive premium – consider whether IV is likely to expand or contract
- PCR as a sentiment filter: If PCR is strongly bullish and your technical analysis is also bullish, the confluence increases confidence. If they conflict, proceed cautiously
Integrating Option Chain with Max Pain
Max Pain is the price at which the maximum number of options expire worthless, causing the least payout by option sellers. It is calculated from the option chain’s OI distribution. On expiry day, markets often gravitate toward the max pain level, especially in the final hours. Combining max pain with the highest call/put OI levels gives you three reference points: max pain as the likely gravitational centre, highest call OI as resistance, and highest put OI as support. This three-level framework, derived entirely from the option chain, provides a probabilistic range for the expiry session that complements your technical chart analysis.
Common Mistakes in Option Chain Analysis
- Treating OI levels as guaranteed support/resistance – they are probabilistic, not certain. Price can and does break through high-OI levels
- Looking at only one snapshot – OI changes throughout the day; a single look at 9:15 AM is insufficient
- Ignoring the option chain entirely and trading options based only on the price chart – you are missing half the information
- Over-complicating – focus on highest call/put OI, OI changes, and PCR. These three give you 90% of the useful information
Frequently Asked Questions
How do I read an option chain?
Calls are on the left, puts on the right, strike prices in the centre. Focus on Open Interest (where money is positioned), Change in OI (where positioning is shifting), and Volume (where activity is happening). The highest call OI strike suggests resistance; the highest put OI strike suggests support.
Where can I find the option chain for Nifty?
NSE’s website (nseindia.com) provides the official Nifty option chain. Broker platforms (Zerodha, Sensibull, Opstra) provide more user-friendly versions with additional analytics like OI heatmaps and PCR graphs.
Is option chain analysis enough to trade options?
It is a powerful complementary tool, not a standalone strategy. Combine option chain analysis with technical analysis (chart levels, trends, candlestick patterns) and Greek analysis (Delta, Theta, Vega awareness) for a complete decision framework.
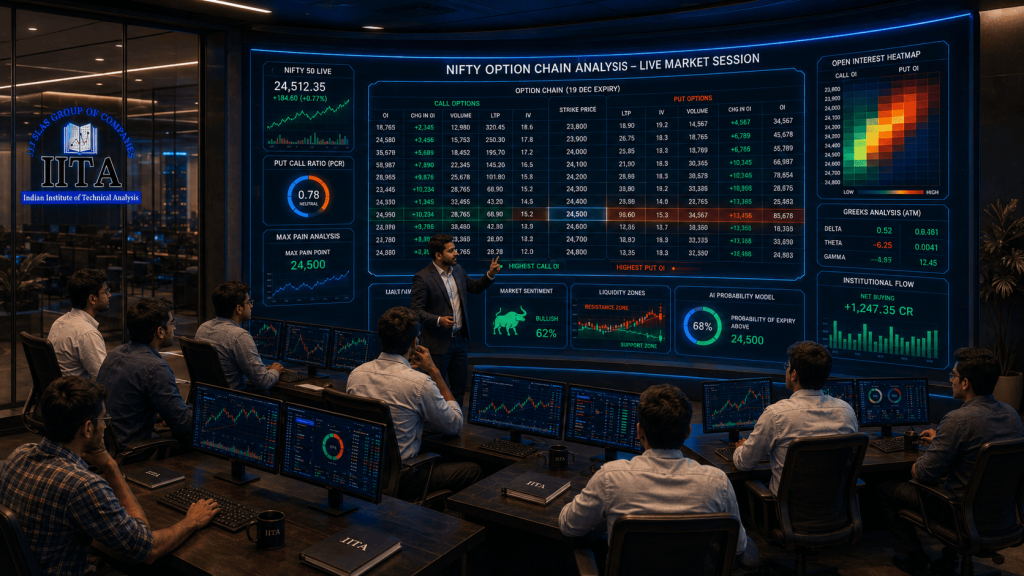
Learn Option Chain Analysis and Options Mastery with IITA Bhubaneswar
At IITA (Indian Institute of Technical Analysis), Bhubaneswar, concepts like these are not taught from slides alone. Our trainers demonstrate on live market charts, letting you practise in real conditions with mentor guidance.
- Live market sessions – learn by doing, not just watching
- Experienced traders as trainers who practise what they teach
- Small batches for personal attention and doubt-clearing
- Post-course mentorship so support continues after class ends
- Classroom and online options available across Odisha
Visit iita.tech or call us to book a free introductory workshop.
Disclaimer: Stock market trading involves financial risk. This article is for educational purposes only and is not investment advice.
IITA – iita.tech