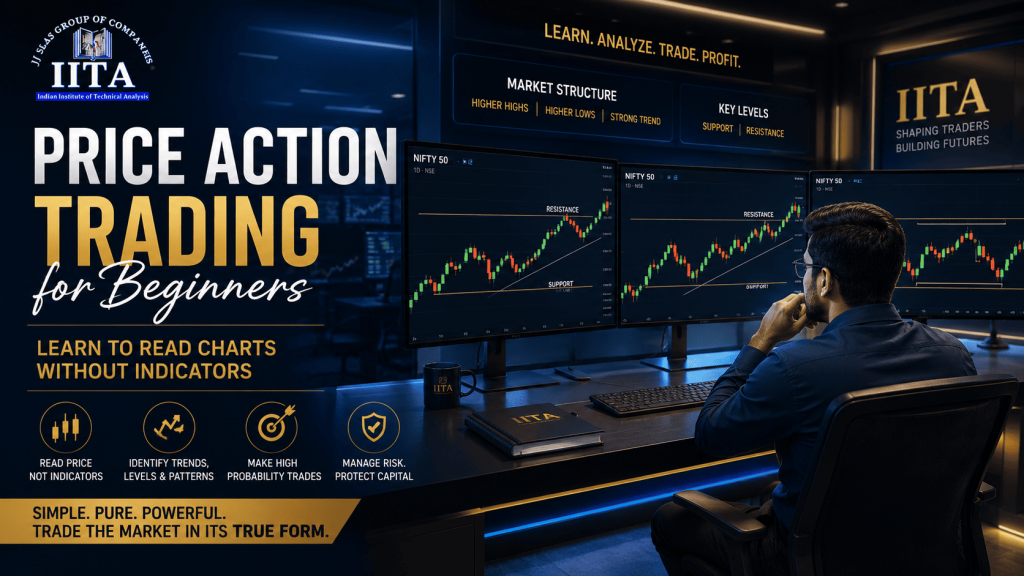
Price Action Trading for Beginners: How to Read the Chart Without Indicators
Strip every indicator off your chart. Remove the moving averages, the RSI, the MACD, the Bollinger Bands. What you are left with is price action – the raw movement of price expressed through candlesticks. Price action trading is the discipline of making all your trading decisions from this raw chart alone, reading what buyers and sellers are actually doing rather than what a mathematical formula says they might be doing.
This is not about being anti-indicator. It is about building the foundational skill that makes every indicator more useful: the ability to read the chart itself. This guide explains how price action works, what to look for, and how to build a trading approach around pure price reading.
Why Trade Price Action?
- Price is the primary data. Every indicator is derived from price. RSI is calculated from price. Moving averages are averages of price. MACD is the difference between two moving averages of price. When you read price directly, you are reading the source, not the derivative
- No lag. Indicators lag because they calculate averages of past data. Price action is real-time – you see what is happening NOW, not what happened over the last 14 or 50 periods
- Simplicity. A clean chart with candlesticks and horizontal levels is easier to read than a chart cluttered with five overlapping indicators giving contradictory signals
- Universality. Price action works on every market (Nifty, stocks, forex, crypto), every timeframe (1-minute to monthly), and never becomes obsolete because it reads human behaviour, not mathematical artefacts
The Three Pillars of Price Action Trading
Pillar 1: Market Structure (Trend Direction)
Before anything else, identify the trend using the raw chart. An uptrend makes higher highs and higher lows – each peak is higher than the previous peak, and each dip is higher than the previous dip. A downtrend makes lower highs and lower lows. A sideways market bounces between horizontal boundaries. This structure tells you the direction to trade: trade with the trend, not against it.
When the structure breaks – an uptrend makes a lower low, for example – the trend may be changing. This is a critical price action signal that indicators often lag in detecting.
Pillar 2: Key Levels (Support and Resistance)
Mark the horizontal levels where price has repeatedly reversed. These are the battlegrounds where buyers and sellers concentrate, and price action at these levels carries the most information. A bullish candlestick pattern at a strong support level in an uptrend is a high-probability buy signal. The same pattern in the middle of nowhere with no level confluence is noise.
Price action traders focus on levels first, patterns second. The level gives the pattern its context and significance.
Pillar 3: Candlestick Signals at Key Levels
At a key level, watch the individual candles for signals of buyer or seller dominance:
- Rejection wicks – long wicks that reject a level (Hammers at support, Shooting Stars at resistance) show one side was overpowered
- Engulfing candles – a large candle that completely swallows the previous candle shows a shift in control
- Inside bars – a candle whose range is entirely within the previous candle shows compression before a potential breakout
- Pin bars – candles with very long wicks and tiny bodies, showing sharp rejection of a price level
The signal gains meaning from the level it occurs at and the trend context it occurs in. A pin bar at a major support level in an uptrend is a high-quality signal. The same pin bar in a choppy, levelless area is meaningless.
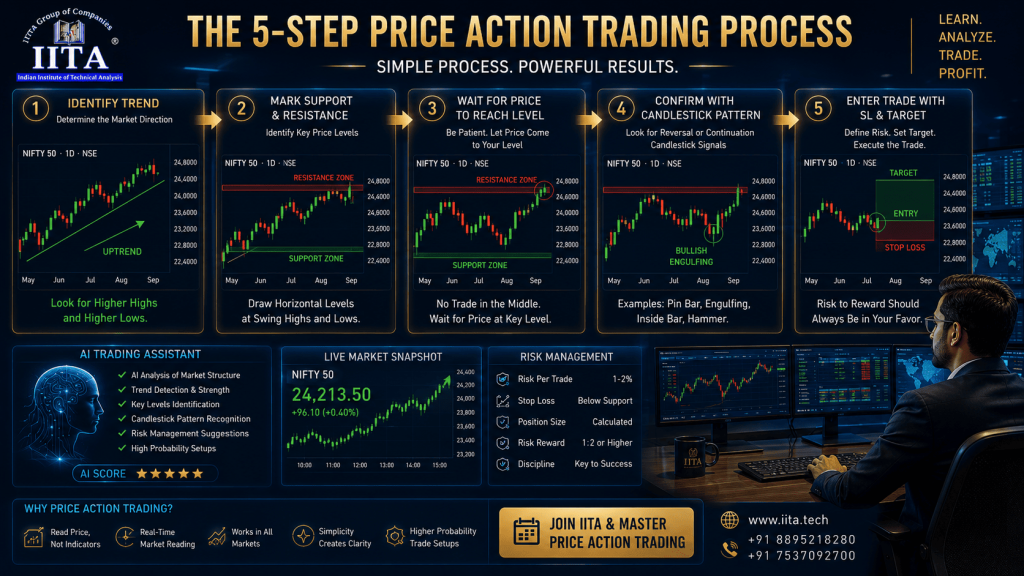
A Price Action Trading Process
Step-by-step, how a price action trader analyses and enters:
- Step 1: Identify the trend – higher highs/higher lows or lower highs/lower lows?
- Step 2: Mark key levels – where has price clearly reversed multiple times?
- Step 3: Wait for price to reach a key level – patience; do not trade in no-man’s-land between levels
- Step 4: Watch for a candlestick signal at the level – rejection wick, engulfing, pin bar
- Step 5: Enter with a stop loss beyond the level and a target at the next level
This process is intentionally simple. Price action trading is about discipline and patience, not complexity. Most of a price action trader’s time is spent waiting, not trading.
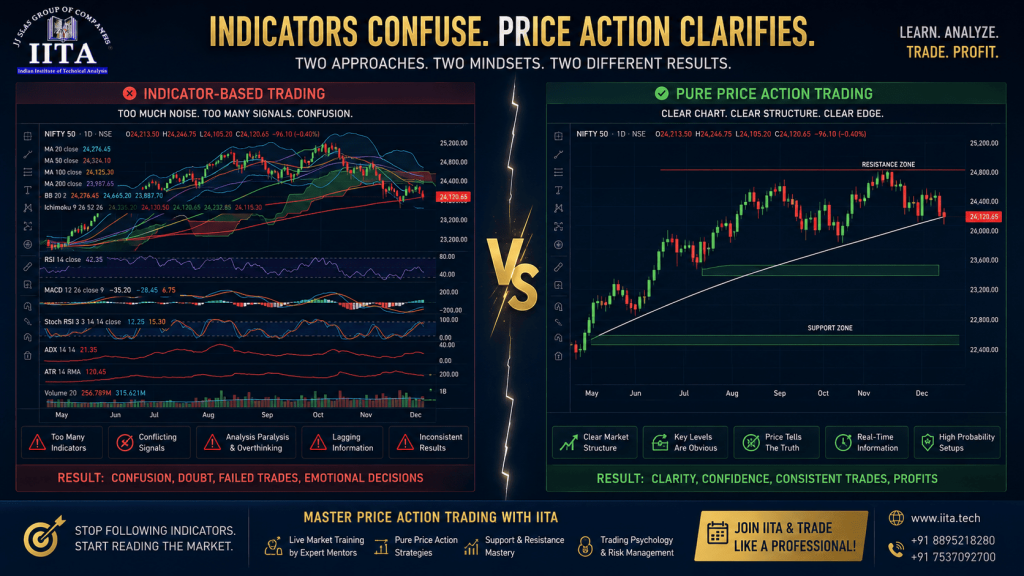
Price Action vs Indicator Trading
This is not a war – it is a spectrum. Many excellent traders combine price action reading with one or two confirming indicators (like volume or a moving average for trend confirmation). The point is that price action is the foundation. An indicator that confirms what the price is already showing adds confidence. An indicator that contradicts the obvious price action should be questioned, not followed blindly.
The worst approach is relying solely on indicators without understanding the price they are calculated from. That is like reading a translation without understanding the original language.
Volume: The Price Action Trader’s Confirmation Tool
While price action purists use minimal indicators, most acknowledge one exception: volume. Volume is not a derived indicator – it is primary data, telling you how many participants confirm a price move. A breakout above resistance on high volume is genuine conviction. The same breakout on low volume is suspicious. A rejection wick at support with rising volume signals real buying power. The same wick on thin volume is less reliable. Price shows what is happening; volume shows whether to believe it. Together, they form the complete price action picture.
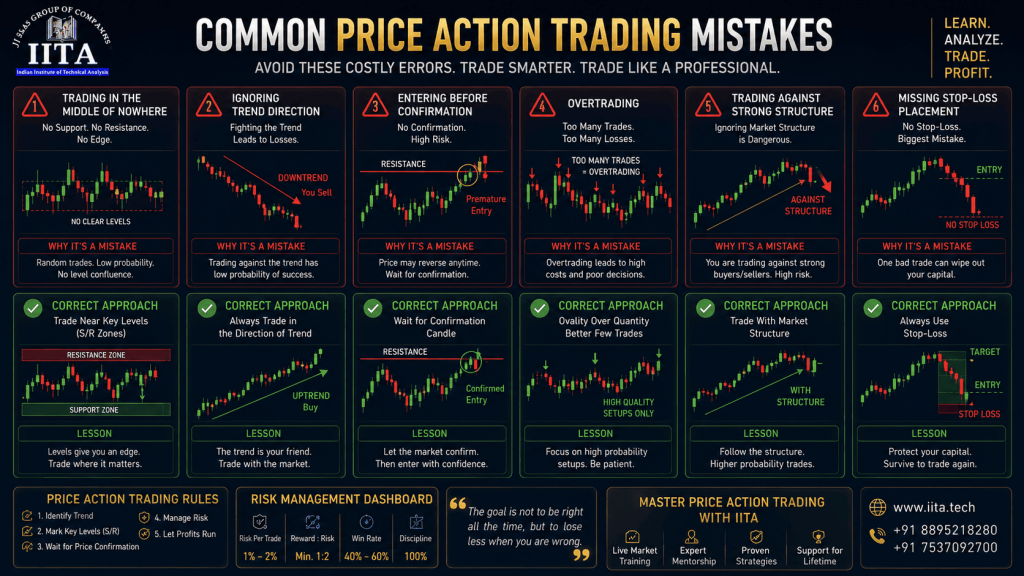
Common Mistakes in Price Action Trading
- Trading signals at random locations instead of key levels – context is everything
- Ignoring the trend and trading reversal signals against a strong move
- Over-trading – price action traders should take fewer, higher-quality trades
- Expecting perfection – price action is probabilistic, not guaranteed; stop losses are mandatory
- Jumping between methods – price action takes time to master; switching to indicators after two losses defeats the learning process
Frequently Asked Questions
What is price action trading in simple words?
Price action trading is making buy and sell decisions by reading the raw price movement on a candlestick chart, without using technical indicators. It relies on candlestick patterns, support and resistance levels, and trend structure to identify trading opportunities.
Is price action better than indicators?
Neither is universally better. Price action provides direct, real-time information without lag. Indicators provide mathematical confirmation. The best approach for most traders is a price-action-first foundation with one or two indicators for confirmation.
How long does it take to learn price action?
The concepts can be learned in weeks. Developing the pattern recognition and discipline to trade price action profitably in live markets typically takes 3–6 months of consistent practice. A trading journal accelerates the learning significantly.

Learn Price Action and Advanced Chart Reading with IITA Bhubaneswar
At IITA (Indian Institute of Technical Analysis), Bhubaneswar, concepts like these are not taught from slides alone. Our trainers demonstrate on live market charts, letting you practise in real conditions with mentor guidance.
- Live market sessions – learn by doing, not just watching
- Experienced traders as trainers who practise what they teach
- Small batches for personal attention and doubt-clearing
- Post-course mentorship so support continues after class ends
- Classroom and online options available across Odisha
Visit iita.tech or call us to book a free introductory workshop.
Disclaimer: Stock market trading involves financial risk. This article is for educational purposes only and is not investment advice.