What Is Volume in the Stock Market? How to Read It Correctly
Volume in the stock market is the total number of shares (or contracts) traded during a specific period, such as a day, an hour, or a minute. It is one of the most important yet most overlooked tools in technical analysis. Volume tells you the strength and conviction behind a price move. A price rise on high volume means many traders are committed to that move; a rise on low volume is weak and likely to fail.
This guide explains what volume is, why it matters, and how to read it to confirm price moves, spot breakouts, and avoid traps, all in simple English.
Why Volume Matters
Think of volume as the fuel behind a price move. Price tells you the direction; volume tells you whether to believe it. A move backed by strong volume has genuine participation and conviction. A move on weak volume often lacks follow-through and reverses quickly.
Here is the core principle every trader must internalise: price shows you what is happening; volume confirms whether it is real. This single idea separates traders who get trapped by false moves from those who avoid them.
Where to Find Volume on a Chart
Volume is almost always displayed as a series of vertical bars at the bottom of your price chart. Each bar shows how many shares were traded during that candle’s time period. Taller bars mean more trading activity; shorter bars mean less. Many platforms colour the volume bars green (when price closed up) and red (when price closed down) for easier reading.
How to Read Volume: The Key Rules
1. Volume Confirms Price Moves
- Rising price + rising volume = strong uptrend (healthy, trustworthy move)
- Rising price + falling volume = weak uptrend (the move may be running out of steam)
- Falling price + rising volume = strong downtrend (sellers are committed)
- Falling price + falling volume = weak downtrend (the selling may be drying up)
2. Volume Confirms Breakouts
When price breaks above a resistance level or below a support level, volume tells you if the breakout is genuine:
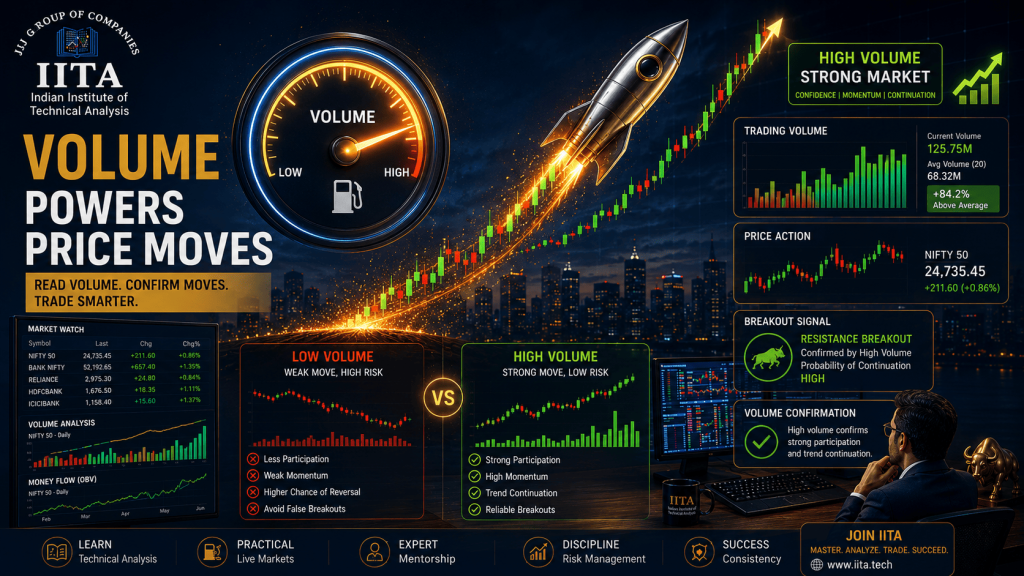
- Breakout + high volume = genuine breakout (likely to continue)
- Breakout + low volume = false breakout (likely to reverse and trap traders)
Example: If Nifty breaks above a key resistance level on heavy volume, the breakout is far more likely to lead to a sustained move than a breakout on thin volume. (See our guides on support and resistance and chart patterns.)
3. Volume Spikes Signal Important Events
A sudden, unusually large volume spike often marks an important moment: a major news event, the start of a strong move, or sometimes the exhaustion of a trend. Sharp volume spikes at the top of an uptrend can signal a climax (everyone buying at once before a reversal), while spikes at the bottom of a downtrend can signal capitulation (panic selling before a bounce).
Volume and Support/Resistance
Volume adds power to support and resistance analysis. A support level that has formed on high volume is stronger than one on low volume, because more traders have a stake at that level. Similarly, when a level breaks on high volume, the break is more meaningful than a break on low volume.
Volume-Based Indicators
Beyond raw volume bars, some indicators are built on volume:
- OBV (On-Balance Volume) – adds volume on up days and subtracts it on down days to show whether volume is flowing into or out of a stock
- VWAP (Volume Weighted Average Price) – the average price weighted by volume, widely used in intraday trading. (See our guide on the best indicators for intraday trading.)
- Volume Profile – shows how much volume traded at each price level, revealing where the most activity occurred
Common Mistakes When Reading Volume
- Ignoring volume entirely and trading on price alone
- Trusting a breakout without checking whether volume confirms it
- Confusing a one-off volume spike with a sustained trend
- Not comparing current volume to the average volume (context matters)
- Forgetting that low-volume stocks can be manipulated more easily

Frequently Asked Questions About Volume
What is volume in the stock market in simple words?
Volume is the number of shares or contracts traded in a given period. It shows how much activity and conviction is behind a price move. High volume means strong participation; low volume means weak participation. It is displayed as bars at the bottom of a chart.
Why is volume important in trading?
Volume confirms whether price moves are genuine. A price rise on high volume is trustworthy; a rise on low volume is weak and may reverse. Volume also confirms breakouts, with high-volume breakouts being far more reliable than low-volume ones.
What is a volume breakout?
A volume breakout occurs when price breaks above resistance or below support accompanied by a sharp increase in volume. The high volume confirms strong participation, making the breakout more likely to continue rather than fail.
How do I know if volume is high or low?
Compare current volume to the recent average volume (many platforms show an average volume line). Volume noticeably above the average is “high,” and volume below it is “low.” Context against the average matters more than the raw number.
Learn Volume Analysis and Complete Technical Analysis at IITA
Volume is one of the most powerful confirmation tools in trading, yet most beginners ignore it. At IITA Bhubaneswar, we teach you to read volume alongside price, patterns, and indicators so you can spot genuine moves and avoid false breakouts.
Our trainers demonstrate volume analysis on live Nifty, Bank Nifty, and stock charts, showing you in real time how volume confirms or warns against a trade.
Why IITA for Technical Analysis Training
- Volume analysis taught on live market charts
- Complete TA curriculum – price, volume, patterns, and indicators together
- Breakout confirmation techniques to avoid common traps
- Hands-on practice during live market sessions
- Both classroom and online options available
Visit iita.tech or call us to book a free workshop.
Disclaimer: Stock market trading involves financial risk. This article is for educational purposes only and is not investment advice.
IITA – iita.tech