Chart Patterns in Trading: A Complete Guide for Beginners
Chart patterns are distinct formations that appear on price charts when you zoom out and look at how price has moved over days or weeks. Unlike candlestick patterns (which form from one to three candles), chart patterns are larger structures made up of many candles that signal whether a trend is about to reverse or continue.
Learning to recognise chart patterns is a core skill in technical analysis. This guide covers the most important chart patterns every trader should know, explained in simple English with practical guidance on how to trade them.

What Is a Chart Pattern?
A chart pattern is a recognisable shape formed by price movements on a chart. These shapes are created by the repeated actions of buyers and sellers at similar price levels, and they tend to resolve in predictable ways. Chart patterns are divided into two main categories:
- Reversal patterns – signal that the current trend is about to change direction
- Continuation patterns – signal that the current trend will likely continue after a brief pause

Reversal Chart Patterns
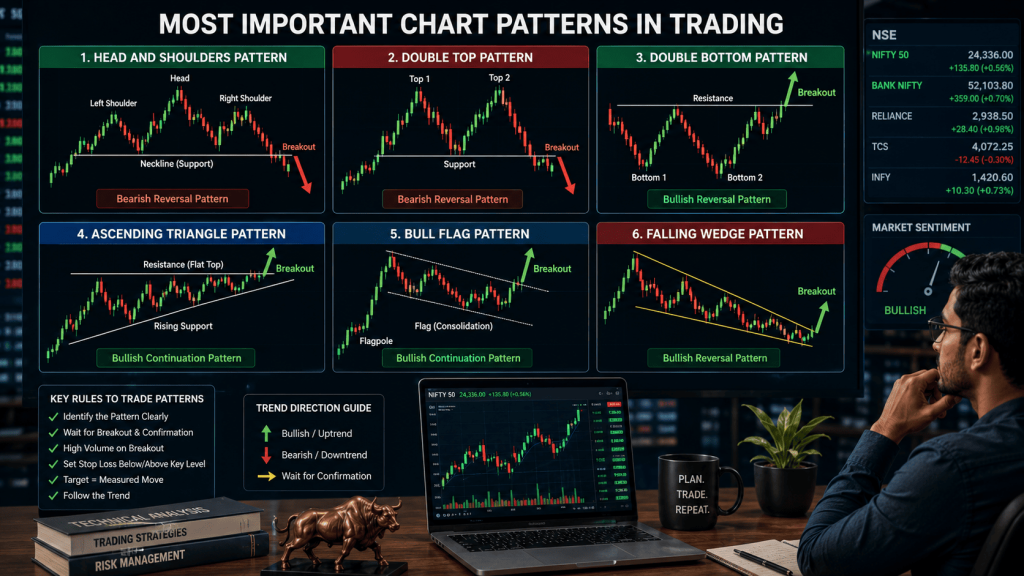
1. Head and Shoulders Pattern
The Head and Shoulders is one of the most reliable reversal patterns in technical analysis. It forms at the top of an uptrend and signals a potential reversal to a downtrend. It has three peaks: a higher middle peak (the head) between two lower peaks (the shoulders), connected by a support line called the neckline.
The pattern confirms when price breaks below the neckline with strong volume. The price target after the breakout is typically equal to the distance from the head to the neckline.
The Inverse Head and Shoulders is the mirror image, forming at the bottom of a downtrend and signalling a reversal upward.
2. Double Top Pattern
A Double Top forms when price rises to a resistance level, pulls back, rises to the same level again, and fails a second time. It looks like the letter “M” on the chart. It signals that buyers cannot push through that resistance and the trend may reverse downward.
Confirmation comes when price breaks below the support level between the two peaks. The target is the distance from the peaks to the support level, projected downward from the breakout point.
3. Double Bottom Pattern
A Double Bottom is the opposite, forming a “W” shape at the bottom of a downtrend. Price falls to a support level, bounces, falls to the same level again, and bounces a second time. It signals a potential reversal upward and confirms when price breaks above the resistance between the two troughs.
Continuation Chart Patterns
4. Triangle Patterns
Triangles form when price makes smaller and smaller swings, converging into a point. There are three types:
- Ascending Triangle – flat resistance on top, rising support below. Usually breaks upward. Bullish bias.
- Descending Triangle – flat support on the bottom, falling resistance above. Usually breaks downward. Bearish bias.
- Symmetrical Triangle – both support and resistance converge equally. Can break either way. Traders wait for the breakout direction and trade accordingly.
Triangles are powerful because the decreasing volatility (the squeeze) stores energy that is released as a strong move when price finally breaks out of the triangle.
5. Flag and Pennant Patterns
A Flag forms after a sharp price move (the flagpole) followed by a brief, narrow consolidation that slopes slightly against the trend. A Pennant is similar but the consolidation forms a small symmetrical triangle instead of a parallel channel.
Both patterns suggest the original trend will continue after the pause. A bull flag occurs in an uptrend (the flag slopes slightly downward), and a bear flag occurs in a downtrend (the flag slopes slightly upward). These are favourite patterns among momentum traders.
6. Wedge Patterns
A Wedge looks like a triangle but with both trendlines sloping in the same direction:
- Rising Wedge – both support and resistance lines slope upward, but resistance is less steep. This is bearish and often appears before a downward reversal.
- Falling Wedge – both lines slope downward, but support is less steep. This is bullish and often appears before an upward reversal.

Wedges can be both continuation and reversal patterns depending on context. Always confirm with a breakout and volume.
How to Trade Chart Patterns: A Practical Framework
- Identify the pattern – make sure the formation is clear and complete, not half-formed
- Wait for the breakout – never trade a pattern before it has confirmed. Entering inside a triangle or before a neckline breaks is gambling.
- Confirm with volume – a breakout on high volume is far more reliable than one on low volume
- Set your stop loss – place it on the opposite side of the breakout. For a Head and Shoulders breakdown, stop loss goes above the right shoulder. For a triangle breakout upward, stop loss goes below the lower trendline.
- Calculate your target – most chart patterns have a measured move target based on the height of the pattern. Use this to set your profit target and check that the risk-reward ratio is at least 1:2.

Common Mistakes with Chart Patterns
- Seeing patterns that are not really there (forcing a pattern onto the chart)
- Trading before the pattern confirms with a breakout
- Ignoring volume – a breakout without volume is often a false breakout
- Confusing candlestick patterns with chart patterns – they are different tools
- Using chart patterns without considering the broader trend context
Frequently Asked Questions About Chart Patterns
What is the most reliable chart pattern?
The Head and Shoulders pattern and its inverse are widely considered among the most reliable. However, no pattern works 100% of the time. Always confirm with volume and use a stop loss.
Are chart patterns different from candlestick patterns?
Yes. Candlestick patterns are formed by one to three individual candles and signal short-term reversals or continuations. Chart patterns are larger formations made of many candles that develop over days to weeks and signal bigger moves. Both are useful tools in technical analysis. (See our guide on candlestick patterns for beginners.)
Do chart patterns work in Indian markets?
Yes. Chart patterns work on Nifty, Bank Nifty, individual stocks, and all liquid markets. The patterns reflect human psychology, which is the same everywhere.
Learn to Spot Chart Patterns in Real Time at IITA Bhubaneswar
Identifying chart patterns on historical charts is one thing. Spotting them as they form in a live, moving market is a completely different skill. At IITA, our trainers teach you to read chart patterns on live Nifty and stock charts during the course, building your pattern recognition ability in real conditions.

Why IITA for Chart Pattern Training
- Live pattern identification on real-time charts during market hours
- Complete technical analysis curriculum covering candlestick patterns, chart patterns, indicators, and risk management
- Practice-first approach – you draw and trade patterns, not just memorise them
- Mentorship and review of your pattern analysis after each session
Sharpen your eye for patterns. Visit iita.tech or call us for a free workshop.
Disclaimer: Stock market trading involves financial risk. This article is for educational purposes only and is not investment advice.