
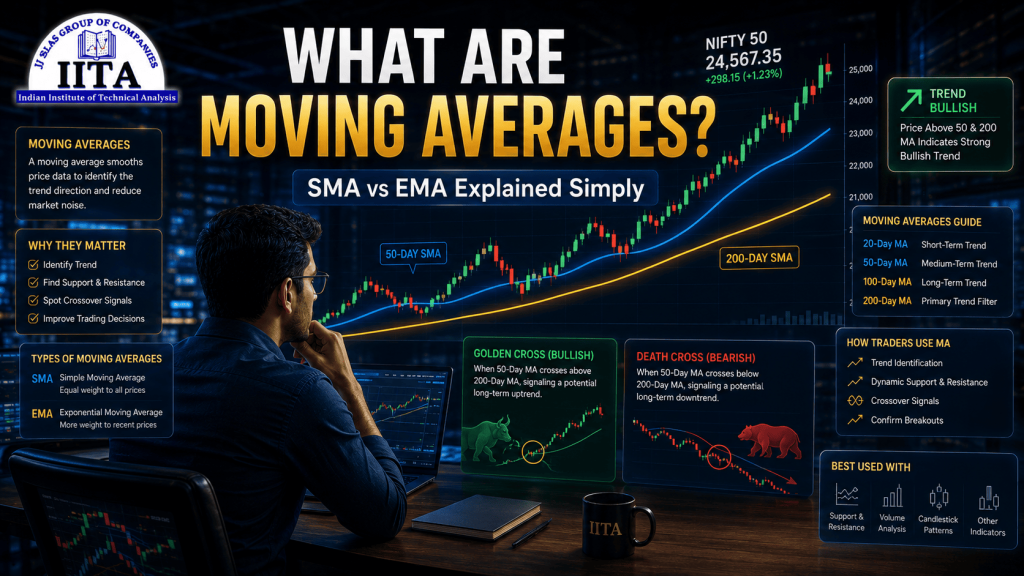
What Are Moving Averages? SMA vs EMA Explained Simply
A moving average is one of the most fundamental and widely used tools in technical analysis. It smooths out the ups and downs of price by calculating the average price over a set number of periods, creating a single flowing line on your chart that reveals the underlying trend direction. Moving averages help traders cut through the noise and answer a simple question: which way is price really heading?
This guide explains what moving averages are, the difference between the two main types (SMA and EMA), and how traders use them, all in plain English.
Why Use a Moving Average?
Raw price action can be noisy and confusing, jumping up and down from candle to candle. A moving average filters out this noise and shows you the smoothed, underlying direction. If the moving average is sloping up, the trend is up. If it is sloping down, the trend is down. This simple clarity is why moving averages are the foundation of countless trading strategies.
The Two Main Types: SMA vs EMA
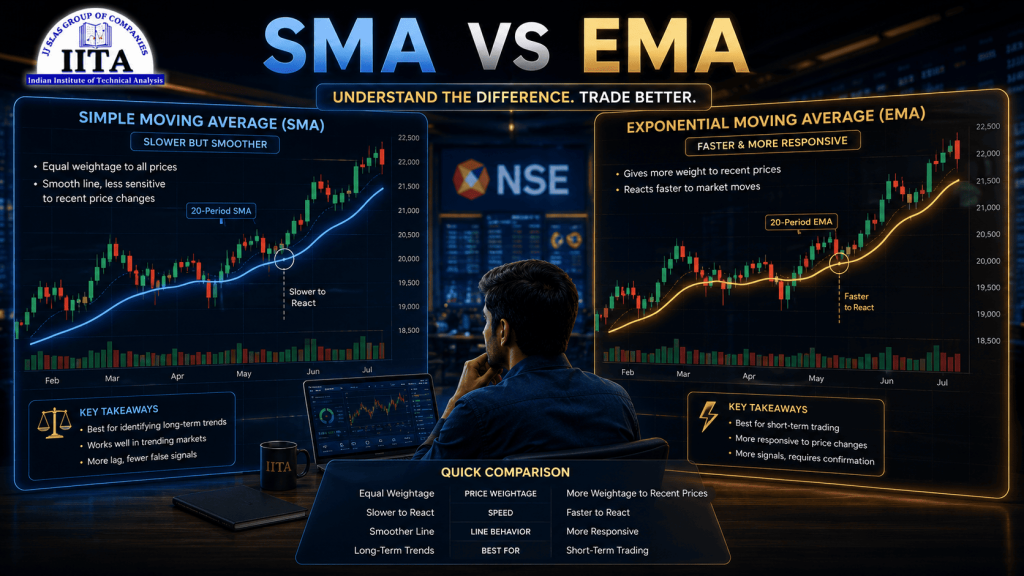
Simple Moving Average (SMA)
The Simple Moving Average calculates the average of the closing prices over a set number of periods, giving equal weight to each price. For example, a 20-day SMA adds up the last 20 closing prices and divides by 20. As each new day arrives, the oldest price drops off and the newest is added, so the average “moves” forward.
The SMA is smooth and stable but reacts slowly to recent price changes because it treats a price from 20 days ago the same as yesterday’s price.
Exponential Moving Average (EMA)
The Exponential Moving Average also averages prices, but it gives more weight to recent prices. This makes the EMA react faster to new price movements than the SMA. Because of this responsiveness, most active and intraday traders prefer the EMA.
The key difference: SMA is smoother and slower (good for identifying the broad trend); EMA is faster and more responsive (good for timely signals). Neither is universally better; they serve different purposes.
The Most Important Moving Averages to Know
- 20-day MA – short-term trend, popular with swing traders
- 50-day MA – medium-term trend, one of the most watched levels by traders and institutions
- 100-day MA – longer-term trend confirmation
- 200-day MA – the long-term trend benchmark. Price above the 200-day MA is considered a long-term bull market; below it, a bear market
For intraday trading, shorter EMAs like the 9-period and 21-period are popular. (See our guide on the best indicators for intraday trading.)

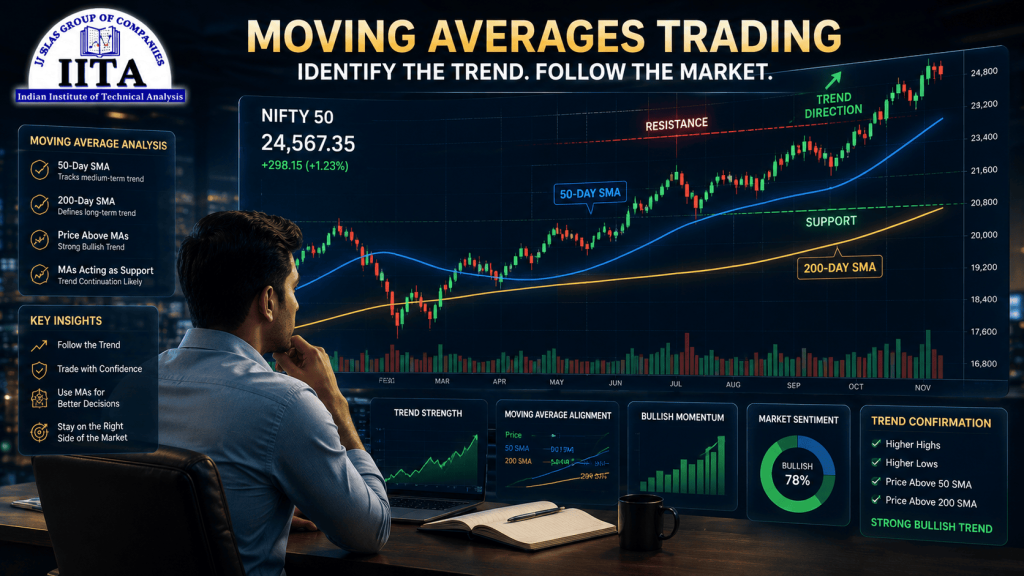
How Traders Use Moving Averages
1. Identifying the Trend
The simplest use: if price is above a rising moving average, the trend is up. If price is below a falling moving average, the trend is down. This keeps you on the right side of the market.
2. Dynamic Support and Resistance
Moving averages often act as moving (dynamic) support and resistance levels. In an uptrend, price frequently pulls back to the 50-day MA and bounces. In a downtrend, price often rises to the 50-day MA and falls back. (See our guide on support and resistance.)
3. Moving Average Crossovers
When a shorter moving average crosses a longer one, it signals a potential trend change:
- Golden Cross: when the 50-day MA crosses above the 200-day MA, signalling a potential long-term uptrend (bullish)
- Death Cross: when the 50-day MA crosses below the 200-day MA, signalling a potential long-term downtrend (bearish)
For intraday trading, the 9 EMA crossing the 21 EMA is a popular short-term crossover signal.
Combining Moving Averages with Other Tools
Moving averages work best when combined with other analysis. A price bouncing off the 50-day MA at a known support level, with a bullish candlestick pattern and rising volume, is a far stronger signal than the moving average alone. Never rely on a single tool. (See our guide on what technical analysis is.)
Common Mistakes with Moving Averages
- Using moving averages in choppy, sideways markets where they produce false signals
- Acting on every crossover without confirmation from price and volume
- Using too many moving averages and cluttering the chart
- Treating the moving average as a precise level instead of a zone
- Ignoring the broader trend and trading against it
Frequently Asked Questions About Moving Averages
What is a moving average in simple words?
A moving average is a line on a chart that shows the average price over a set number of periods, smoothing out noise to reveal the trend direction. If the line slopes up, the trend is up; if it slopes down, the trend is down.
What is the difference between SMA and EMA?
The Simple Moving Average (SMA) gives equal weight to all prices and is smoother but slower to react. The Exponential Moving Average (EMA) gives more weight to recent prices and reacts faster. Active traders often prefer the EMA; the SMA is good for the broad trend.
What is a golden cross and a death cross?
A golden cross occurs when the 50-day moving average crosses above the 200-day moving average, signalling a potential bullish long-term trend. A death cross is the opposite, when the 50-day crosses below the 200-day, signalling a potential bearish trend.
Which moving average is best for trading?
It depends on your style. The 50-day and 200-day MAs are key for trend identification and long-term analysis. For intraday trading, shorter EMAs like the 9 and 21-period are popular. No single MA is best for everyone.
Master Moving Averages and Indicators at IITA Bhubaneswar
Moving averages are a cornerstone of technical analysis, but using them effectively requires knowing which ones to use, when to trust a crossover, and how to combine them with other tools. IITA teaches you all of this on live charts.
Our trainers demonstrate moving average strategies in real time on Nifty, Bank Nifty, and stock charts, showing you exactly how professionals use them to identify trends and time entries.
Why IITA for Indicator and Trend Training
- Moving average strategies taught on live market charts
- Trend identification techniques that keep you on the right side of the market
- Combination setups using MAs with patterns, volume, and other indicators
- Hands-on practice during live sessions
- Both classroom and online training available
Visit iita.tech or call us to book a free workshop.
Disclaimer: Stock market trading involves financial risk. This article is for educational purposes only and is not investment advice.