Support and Resistance in Trading: How to Find and Use Key Price Levels
If there is one concept that every successful trader uses daily, it is support and resistance. These are the price levels where buyers and sellers repeatedly clash, creating invisible walls on the chart where price tends to stop, reverse, or accelerate. Understanding support and resistance levels is essential for deciding where to enter trades, where to exit, and where to place your stop loss.
This guide explains support and resistance in plain English, shows you how to find these levels on your charts, and teaches you how to use them in real trading, with examples from Indian markets.
What Is a Support Level?
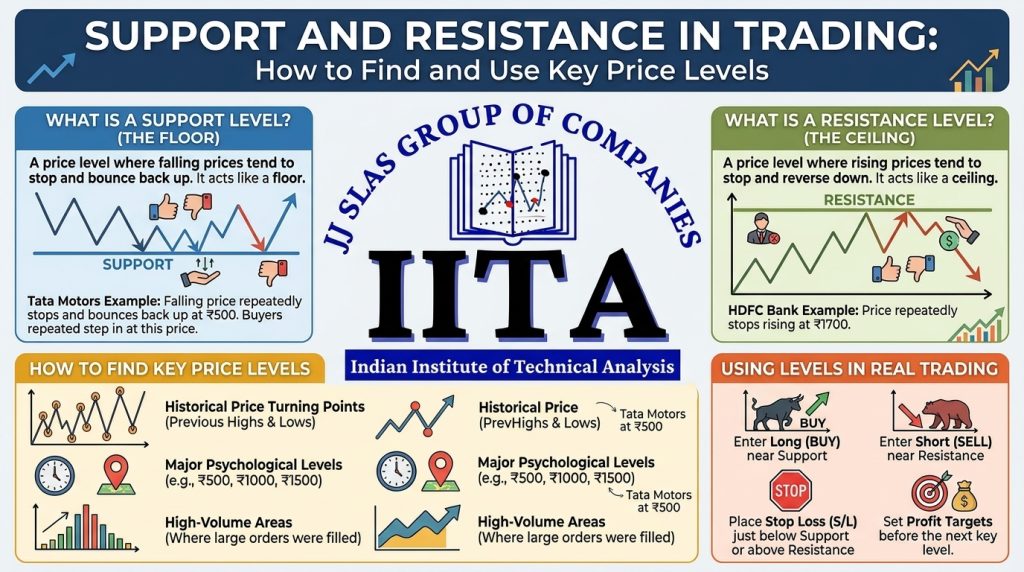
Support is a price level where falling price tends to stop falling and bounce back up. It acts like a floor under the price. At a support level, buyers believe the price has become cheap enough to buy, and their combined buying pressure is enough to overpower the sellers and push the price upward.
Example: If Tata Motors keeps falling to around ₹500 and bouncing back up each time, ₹500 is acting as a support level. Buyers repeatedly step in at that price because they see value.
What Is a Resistance Level?
Resistance is the opposite. It is a price level where rising price tends to stop rising and fall back. It acts like a ceiling above the price. At a resistance level, sellers believe the price has become expensive enough to sell, and their combined selling pressure overpowers the buyers.
Example: If Infosys keeps rising to around ₹1,800 and falling back each time, ₹1,800 is acting as a resistance level. Sellers keep taking profit at that level.
Why Do Support and Resistance Levels Form?
These levels form because of human psychology and memory. Traders remember the prices where they previously bought or sold and react emotionally when price returns to those levels:
Traders who bought at a support level and made money will want to buy there again
Traders who missed buying at support will wait for price to return so they can get in
Traders who sold at resistance and profited will want to sell there again
Traders who failed to sell at resistance before and saw price fall will sell this time
When thousands of traders all act on the same memory at the same price level, the level becomes a real, observable barrier on the chart. The more times a level is tested and holds, the stronger it becomes.
How to Find Support and Resistance Levels on a Chart
Finding these levels is not complicated. Here are the most reliable methods:
1. Previous Highs and Lows (Swing Points)
The simplest and most effective method. Old swing high points often become resistance levels, and old swing low points often become support levels. Open your chart, zoom out to see several months of data, and mark the prices where price has clearly reversed multiple times.
2. Round Numbers (Psychological Levels)
Prices like ₹100, ₹500, ₹1,000, Nifty 20,000, or Bank Nifty 50,000 act as natural support and resistance levels. Why? Because humans think in round numbers and tend to place buy and sell orders at these levels. These are also called psychological levels.
3. Trendlines
A trendline is a straight line drawn along a series of rising lows (in an uptrend) or falling highs (in a downtrend). The trendline itself acts as a moving support or resistance level. When price touches the trendline and bounces, the trendline is holding. When price breaks through, the trend may be changing.
4. Moving Averages as Dynamic Support and Resistance
Popular moving averages like the 50-day moving average and 200-day moving average often act as dynamic (moving) support and resistance levels. In an uptrend, price often dips to the 50-day MA and bounces. In a downtrend, price often rises to the 50-day MA and falls back. Institutional traders and algorithms watch these levels closely.
Role Reversal: When Support Becomes Resistance (and Vice Versa)
One of the most powerful concepts in technical analysis is role reversal. When price breaks above a resistance level, that old ceiling often becomes a new support floor. When price breaks below a support level, that old floor often becomes a new resistance ceiling.
Example: If Nifty breaks above the 24,000 resistance level with strong volume, the next time Nifty dips back to 24,000, it is likely to find support there. Traders use this role reversal to plan entries after breakouts: they wait for price to pull back to the broken level and then enter.
How Traders Use Support and Resistance in Practice
Planning Trade Entries
Buy near support when the overall trend is up. Sell or short near resistance when the overall trend is down. The idea is simple: you are trading at the edge of the range where risk is low and potential reward is high.
Setting Stop Loss
Place your stop loss just beyond the support or resistance level. If you buy near support, your stop loss goes slightly below the support zone. This way, if the level breaks, your loss is limited. This is disciplined trading.
Setting Profit Targets
Your target should be the next support or resistance level in the direction of your trade. If you buy at support, your target is the nearest resistance level above. This gives you a clear, logical exit plan before you enter the trade.
Trading Breakouts
When price breaks through a support or resistance level with high volume, it often triggers a strong move in the breakout direction. Breakout traders enter the trade on the break and ride the momentum. However, false breakouts are common, so volume confirmation and a stop loss are essential.
Important: Support and Resistance Are Zones, Not Exact Lines
This is a mistake almost every beginner makes. Support and resistance are zones, not precise prices. Price often pokes a little past a level before reversing. If you treat them as exact lines, you will get frustrated by stop losses triggered by a few points of overshoot.
Practical approach: Mark your levels as zones (bands of 10–30 points on Nifty, or 1–3% on stocks) rather than single lines. Give your stop loss a little breathing room beyond the zone.
Common Mistakes with Support and Resistance
Treating support and resistance as exact prices instead of zones
Ignoring volume when a level breaks – a breakout on low volume is often a false breakout
Assuming a level will hold forever – no level is unbreakable, which is why stop losses exist
Drawing too many levels until the chart is cluttered – focus on the 2–3 most important levels
Forgetting to check the broader trend – support in a downtrend is weaker than support in an uptrend
Frequently Asked Questions About Support and Resistance
How do I know if a support level will hold?
Can I use support and resistance for intraday trading?
Yes. Intraday traders use support and resistance on shorter timeframes (5-minute, 15-minute charts), often combined with the previous day’s high and low, and intraday indicators like VWAP. See our guide on the best indicators for intraday trading for more.
Are support and resistance enough to trade profitably?
They are a strong foundation, but they work best when combined with trend analysis, volume confirmation, candlestick patterns at key levels, and strict risk management. No single tool or concept is enough on its own.
What is the difference between support/resistance and supply/demand zones?
Supply and demand zones are a closely related concept. A demand zone is essentially a support area where aggressive buying occurred, and a supply zone is a resistance area where aggressive selling occurred. The core idea is the same: identifying price levels where buyer or seller pressure is concentrated.
Master Support and Resistance with IITA Bhubaneswar
Drawing lines on a chart is easy. Knowing which lines actually matter, and how to trade around them with discipline, takes practice under expert guidance. At IITA Bhubaneswar, that is exactly what you get.
Our trainers help you identify the support and resistance levels that institutional traders are watching, not just random lines on a chart. You practise drawing and trading these levels on live market data during the course itself, so you develop real skill, not just theory.

What Sets IITA Apart
Live market analysis – learn to spot real support and resistance levels as the market moves
Practical exercises – draw levels, plan trades, and review outcomes with your mentor
Continued mentorship – get support even after completing the course
Multiple market coverage – learn on Indian equities, derivatives, and forex
Ready to go beyond theory? Visit iita.tech or call us to book a free introductory workshop.
Disclaimer: Stock market trading involves financial risk. This article is for educational purposes only and is not investment advice.
IITA – iita.tech